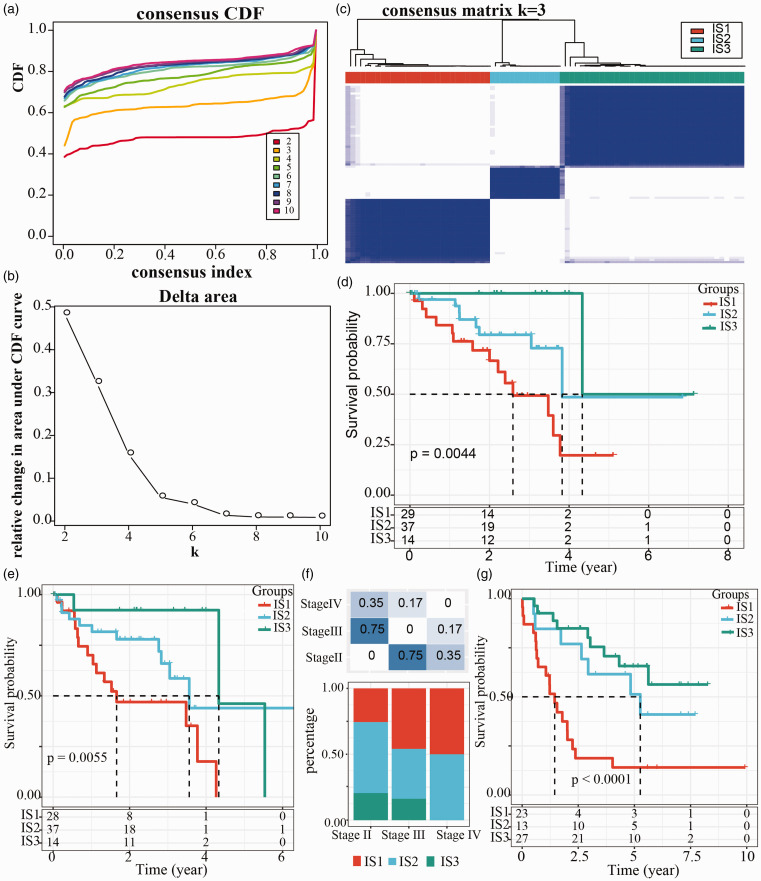
Figure 2.
Immune subtyping of uveal melanoma in TCGA dataset. (a) Cumulative distribution function (CDF) curves analyzed in TCGA dataset. Category numbers (k = 2 to 10) were shown in different colors. (b) CDF delta area curves (k = 2 to 10) analyzed in TCGA dataset. (c) Cluster heatmap when k = 3. Samples were stratified into three immune subtypes (IS1, IS2, and IS3). (d) Kaplan-Meier survival curves of immune subtypes and overall survival in TCGA dataset. (e) Kaplan-Meier survival curves of immune subtypes and progression-free survival in TCGA dataset. (f) The distribution of three immune subtypes in the stage II, III, and IV in TCGA dataset. Chi-square test was performed. (g) Kaplan-Meier survival curves of immune subtypes and overall survival in GSE22138 dataset. Log-rank test was performed in survival analysis. (A color version of this figure is available in the online journal.)

