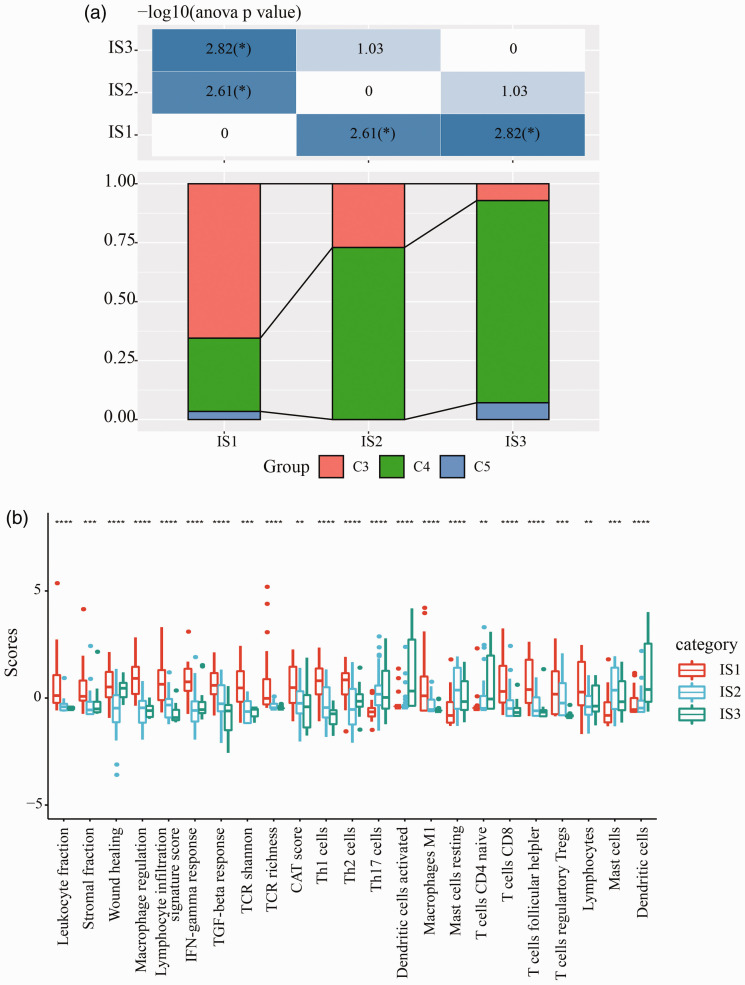
Figure 6.
(a) Distribution of C3, C4, and C5 subtypes in IS1, IS2, and IS3 groups. Chi-square test was performed. (b) Distribution of 23 immune-related signatures with significant difference within IS1, IS2, and IS3 groups. ANOVA was performed within three groups. *p < 0.05, **p < 0.01, ***p < 0.001, ****p < 0.0001. (A color version of this figure is available in the online journal.)

