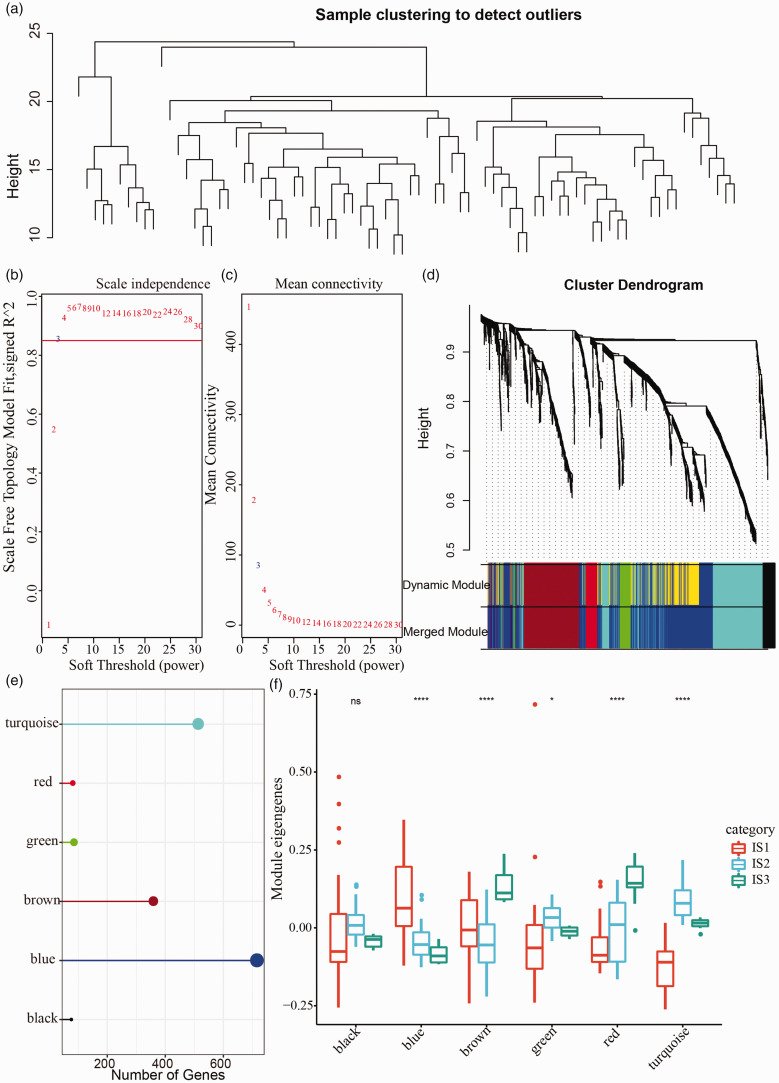
Figure 9.
Co-expression gene analysis in TCGA-UVM dataset. (a) Cluster analysis of 80 samples. (b) Analysis of the scale-free fit index for various soft-thresholding powers. (c) Analysis of the mean connectivity for various soft-thresholding powers. (d) Cluster dendrogram generated by average-linkage hierarchical clustering based on topological overlap matrix and dynamic branch cutting. Modules were merged when height = 0.25, deepSplit = 2, minModuleSize = 30. (e) Quantity of gene numbers in each module. (f) Distribution of eigengenes of six modules in three immune subtypes. *p < 0.05, ****p < 0.0001. (A color version of this figure is available in the online journal.)
ns: no significance.

