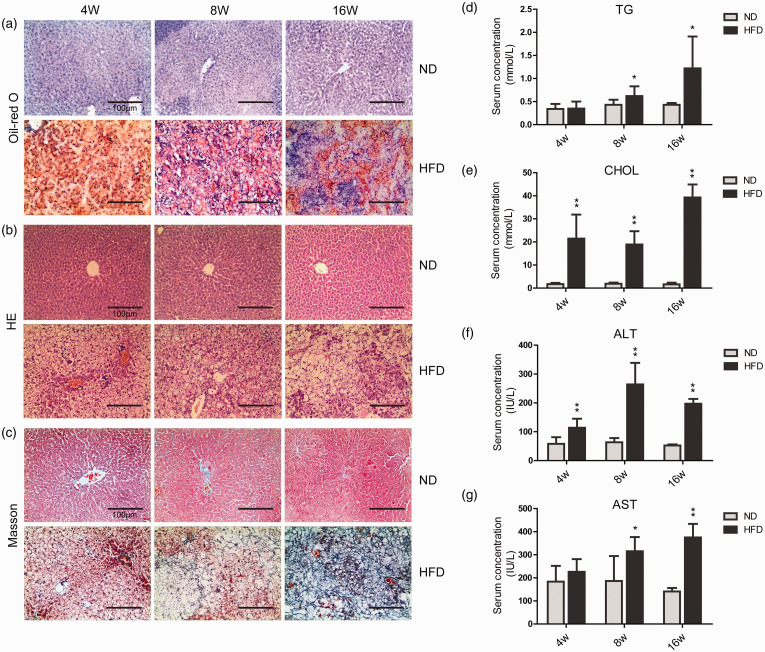
Figure 1.
Representative liver sections and the analysis of serum samples. (a) Oil-red O stained gerbil liver sections (scale bar = 100 μm). (b) HE stained liver sections (scale bar = 100 μm). (c) Masson stained liver sections (scale bar = 100 μm). (d) Serum concentrations of TG. (e) Serum concentrations of CHOL. (f) Serum concentrations of ALT. (g) Serum concentrations of AST. ND, normal diet; HFD, high-fat diet; 4W, 4-week; 8W, 8-week; 16W, 16-week. Experimental results are shown as the mean value ± SD (n= 6). *P < 0.05, **P < 0.01. (A color version of this figure is available in the online journal.)

