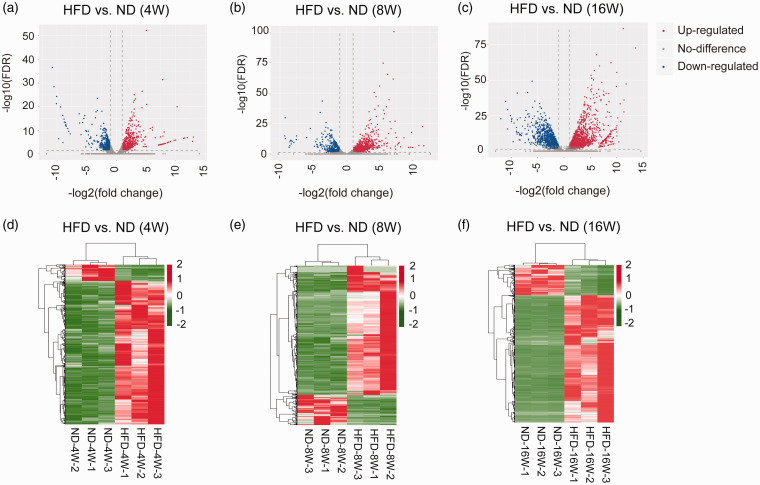
Figure 3.
The expression profiles of the DEGs from the pairwise comparisons at 4W, 8W, and 16W time points. (a to c).Volcano plot of effect size (log2 FC) and −log10 (FDR) of the DEGs from 4W, 8W and 16W time points. (d to f). Heatmap of the DEGs from 4W, 8W, and 16W time points. (A color version of this figure is available in the online journal.)

