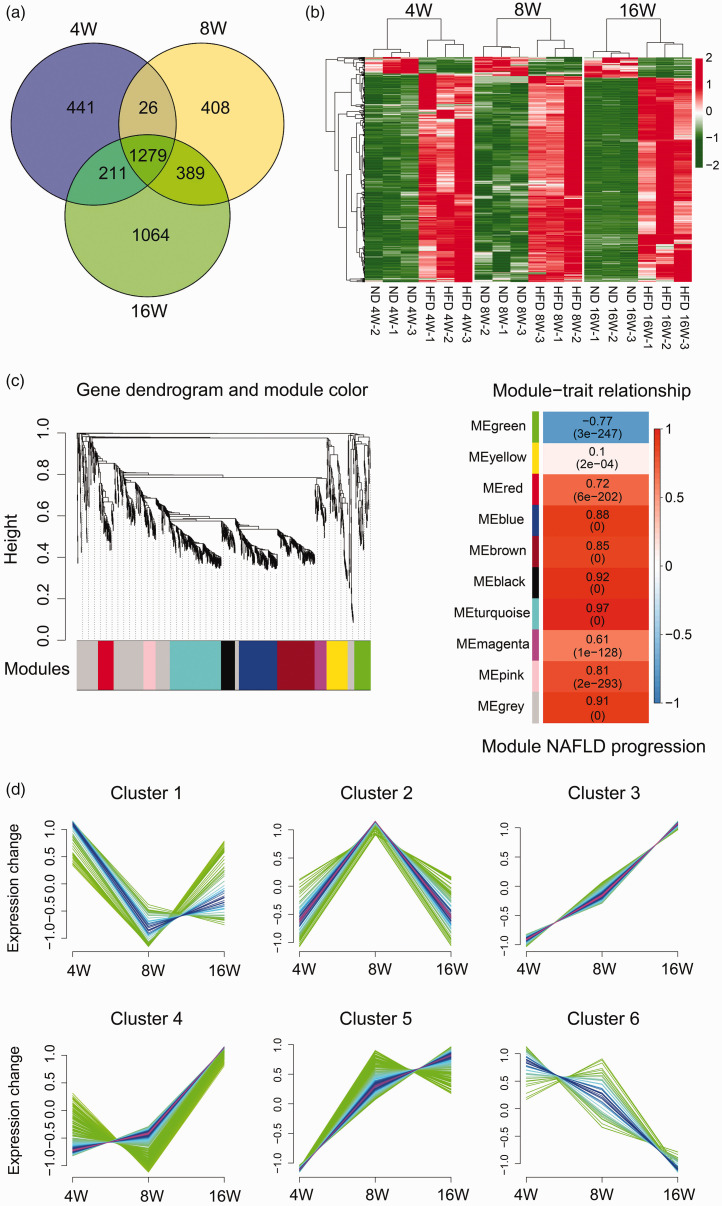
Figure 4.
Analysis of the overlapping DEGs of the pairwise comparisons from 4W, 8W, and 16W groups. (a) The Venn diagram presents the number of DEGs from three pairwise comparisons. (b) Heatmap of the DEGs from the three pairwise comparisons. (c) WGCNA analysis of the common DEGs of the three pairwise comparisons. The gene dendrogram and module color maps on the left present the co-expressed DEG modules. Each module is marked with a specific color (gray module presents unassigned DEGs). Each vertical line in the “leaf” represents a DEG. The right diagraph shows trait and module relationship analysis. Each column indicates a trait, and each row represents a module eigengene. The numbers in each row represent the correlation coefficient between each module and a trait. The number in brackets represents the P value. (d) Mfuzz clustering analysis. The ordinate shows the expression change of the common DEGs and the abscissa represents the time points. (A color version of this figure is available in the online journal.)

