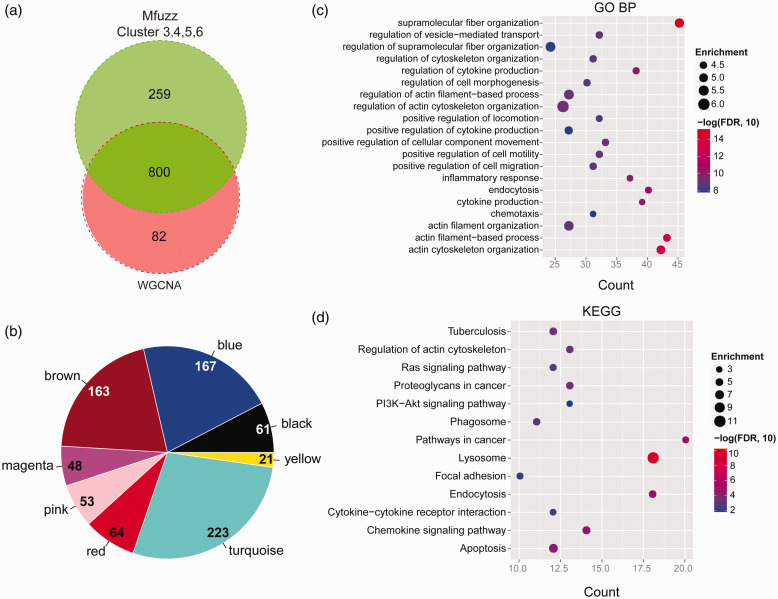
Figure 5.
PPI network generation and enrichment of GO-BP terms or KEGG pathway. (a) Venn diagrams shows the number of DEGs from Mfuzz and WGCNA analysis. (b) The distribution of the common DEGs from Figure 5(a) in each WGCNA modules. (c) GO-BP terms enrichment of the DEGs in the PPI network (Figure S6). (d) KEGG pathway analysis of the DEGs among the PPI network (Figure S6). (A color version of this figure is available in the online journal.)

