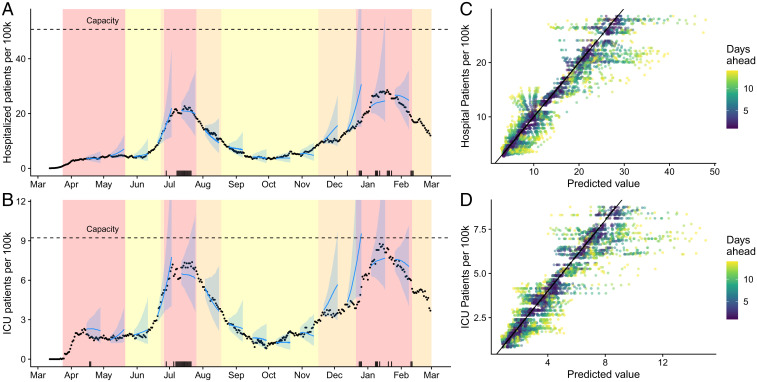
Fig. 3.
Retrospective validation of Austin area COVID-19 hospitalization and ICU projections from March 12, 2020 through February 1, 2021. (A and B) A comparison of predicted and observed (A) COVID-19 hospital census and (B) COVID-19 ICU census. Blue lines and points provide 2-wk-ahead projections with 95% prediction intervals at 14 time points throughout the pandemic; black points are reported data. The black tick marks along the bottom indicate our 30 worst forecasts, that is, dates with large differences between the observed value and our 2-wk-prior prediction of the value. (C and D) Predicted (median) versus observed (C) hospital or (D) ICU COVID-19 census. Colors indicate the time horizon of each prediction; the diagonal line indicates that the predicted value equals the observed value.

