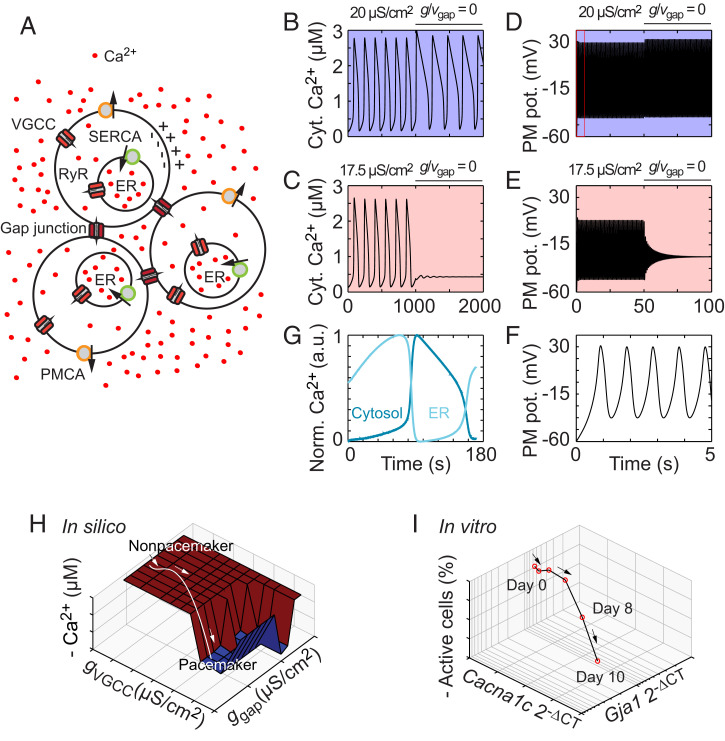
Fig. 2.
Computational modeling reveals the critical roles of VGCC in pacemaker cells and gap junctions in nonpacemaker cells. (A) Schematic view of three interconnected cells. The Ca2+ concentration and membrane potential are modeled in each individual cell. (B–E) Computational modeling of the cytosolic Ca2+ concentration (B and C) and membrane potential (D and E) at conductances of 20 μS/cm2 (B and D) and 17.5 μS/cm2 (C and E). (F) Zoomed-in time course of 5 s from D (boxed region) with five membrane potential oscillatory periods. (G) The ER Ca2+ concentration (light blue) versus the cytosolic Ca2+ concentration (dark blue). (H) Bifurcation analysis with the gap junction and VGCC conductances, ggap and gVGCC, respectively, as bifurcation parameters. The values are ggap (x-axis), gVGCC (y-axis), and the negative oscillation amplitude (z-axis). (I) Trajectory of differentiating ES cells based on the RT-qPCR measurements of Cacna1c and Gja1. The values are the mean expression levels of the connexin-43 gap junction gene Gja1 (x-axis), the Cav1.2 subunit gene Cacna1c (y-axis), and the mean number of oscillating cells (z-axis) at days 0 to 10 of differentiation. Computational data are indicated in silico, and experimental data from differentiating cells are indicated in vitro. Cyt., cytosolic; PM, plasma membrane; pot., potential; a.u., arbitrary unit.

