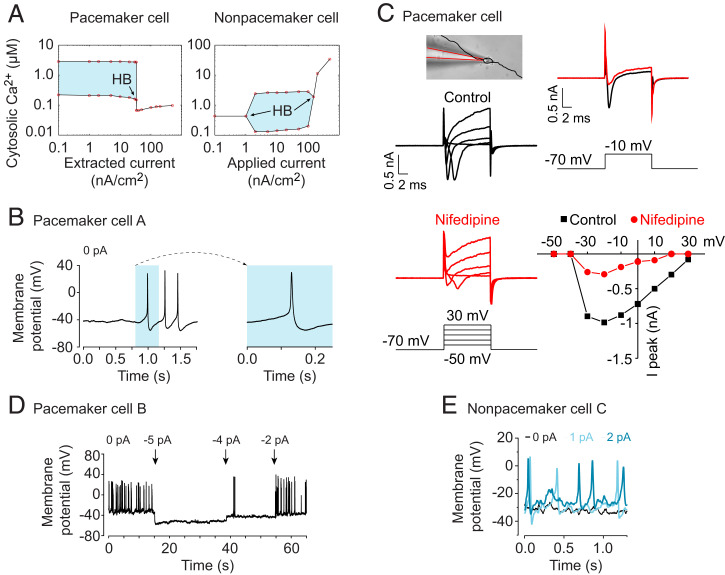
Fig. 4.
Cells can switch between pacemaker and nonpacemaker state by altering the membrane potential. (A) Bifurcation analyses with extracted and applied electrical currents as bifurcation parameters in a pacemaker and nonpacemaker cell, respectively. Hopf bifurcations (HBs) at Iapp = 1 nA/cm2 and 200 nA/cm2. (B) Action potentials in pacemaker cell A measured with patch-clamp recordings. (C) Ion current recordings (voltage-clamp mode) in a pacemaker cell in absence (Control) or presence of 5 μM nifedipine. (Top Left) Photomicrograph showing the cell with the patch pipette attached. Soma and processes are highlighted in black overlay. (Bottom Left) Voltage steps from −50 to +30 mV from −70 mV holding potential. (Top Right) Residual inward current upon a current step from −70 mV to −10 mV. (Bottom Right) Relationship between voltage and current. Peak conductance is seen at around −20 mV. (D) Spontaneous membrane potential activity in pacemaker cell B in which negative currents (−5, −4, and −2 pA) were applied. (E) Spontaneous membrane potential activity in nonpacemaker cell C in which positive currents (1 pA and 2 pA) were applied.

