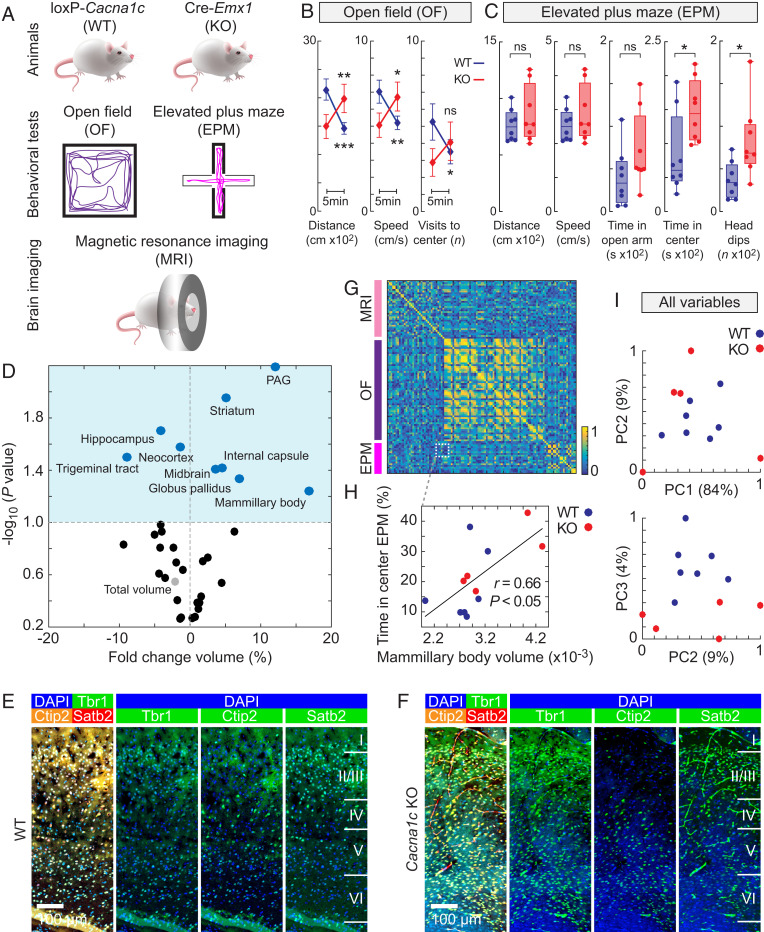
Fig. 5.
Cacna1c KO mice exhibit abnormal brain anatomy and anxiety. (A) Experimental setups for the WT mice and the Cacna1c KO mice generated by Cre-Lox technology and used for the open-field (OF) and elevated plus maze (EPM) behavioral tests and MRI. (B and C) Quantification of the OF (B) and EPM (C) experiments for WT (blue, n = 8) and Cacna1c KO (red, n = 8) mice. Vertical bars represent SEM. For the box plots, the center line shows the median, the upper and lower boundaries of the box show the upper and lower quartiles, and the whiskers show the minimum and maximum values. (D) Volcano plot of the MRI-based volumetric measurements of 33 brain regions. The dark-blue dots indicate reduced and increased volumes, the light-gray dot indicates total brain volume, and the light-blue area indicates P < 0.1 after FDR correction. (E and F) Immunohistochemistry images of the somatosensory cortex in WT and Cacna1c KO mice. Somatosensory cortex was stained with Tbr1, Ctip2, and Satb2. Nuclei were detected using DAPI. (G) Correlation matrix for all variables measured in the EPM and OF tests and MRI. (H) Correlation between the mammillary body volume and the time spent in the center of the EPM behavioral test. The Pearson’s r is stated. (I) Principal component (PC) analysis of all variables in G for the WT (blue, n = 8) and Cacna1c KO (red, n = 8) mice. The percentages of total variance explained by the first three axes (PC1, PC2, and PC3) are given in parentheses. The significance tests for the behavioral tests were calculated using two-way ANOVA with Bonferroni multiple comparisons. The P values for the volcano plot were calculated using unpaired two-tailed t tests. *P < 0.05, **P < 0.01, ***P < 0.005; ns, nonsignificant (P > 0.05). (Scale bars, 100 μm.)

