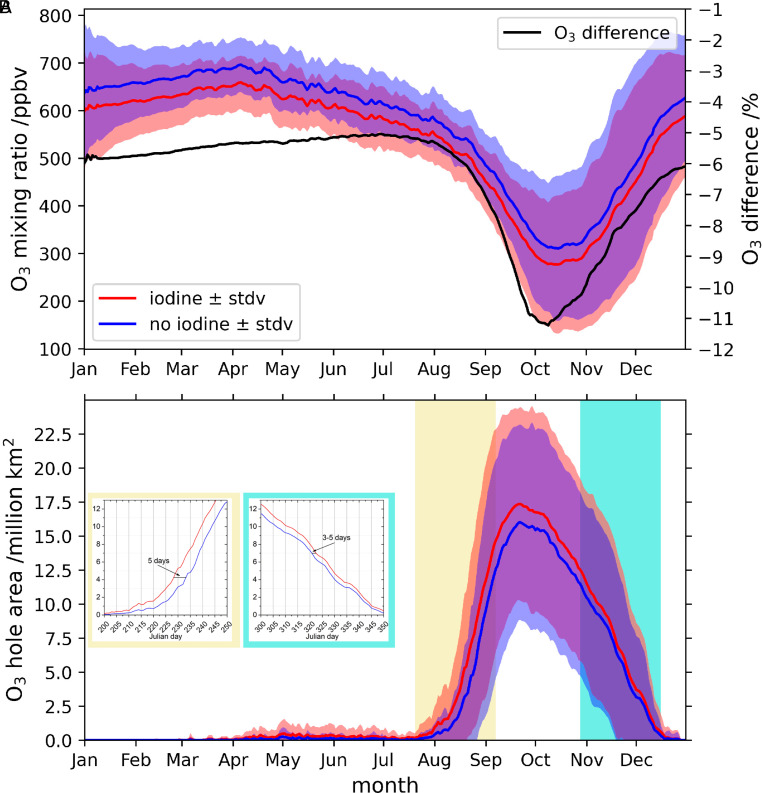
Fig. 4.
Daily evolution of the ozone hole region during the 1980–2015 period. (A) Mean O3 abundance at 11- to 16-km altitude in the region 90°S to 70°S for the simulation including the three halogens (red, “iodine”), and the simulation including only bromine and chlorine (blue, “no iodine”). Left y axis shows the averaged ozone mixing ratio, while right y axis corresponds to the difference (in percentage) between the “iodine” and “no iodine” runs. (B) Evolution of the ozone hole area, defined as the region of ozone values below 220 DU located south of 40°S (https://ozonewatch.gsfc.nasa.gov). Shaded areas represented the SD (±σ) in both ozone mixing ratio and ozone hole area.

