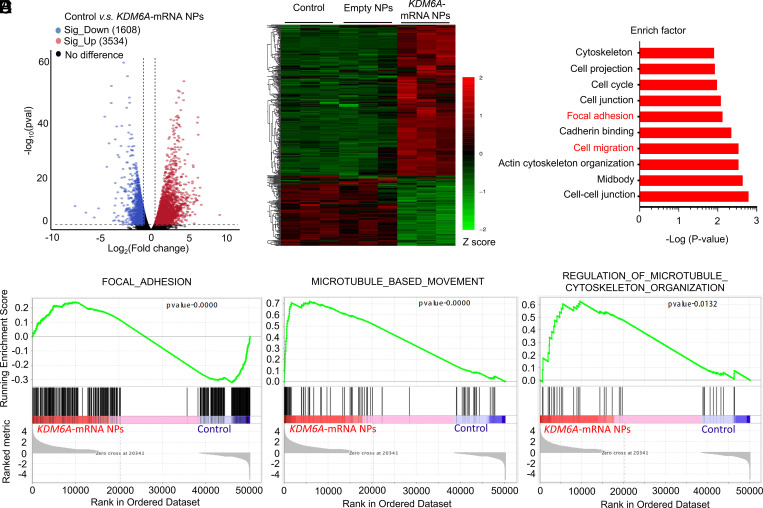
Fig. 3.
Transcriptomic analysis between Kdm6a-null KU19-19 cells (control group) and KDM6A-mRNA NP–treated Kdm6a-null KU19-19 cells (KDM6A-mRNA NPs Group). (A) Volcano plot of gene expression (Control versus KDM6A-mRNA NPs; fold changes ≥ 2; P < 0.05). (B) Hierarchical clustering and heatmap of representative gene expression resulting from control group, Empty NPs Group (i.e., empty NP-treated Kdm6a-null KU19-19 cells), and KDM6A-mRNA NPs Group through transcriptomic sequencing. Row-scaled z-scores of quantile-normalized gene expression (from >5,000 genes; P < 0.0001; Green: down-regulated genes; Red: up-regulated genes). (C) KEGG pathway analysis on the significant gene expression. (D) GSEA of the genes associated with the focal adhesion signaling (P < 0.0001) in control group and KDM6A-mRNA NPs Group. (E) GSEA of the genes associated with the microtubule-based movement signaling (P < 0.0001) in control group and KDM6A-mRNA NPs Group. (F) GSEA of the genes associated with the regulation of microtubule cytoskeleton organization signaling (P = 0.0132) in control group and KDM6A-mRNA NPs Group.

