Fig. 1.
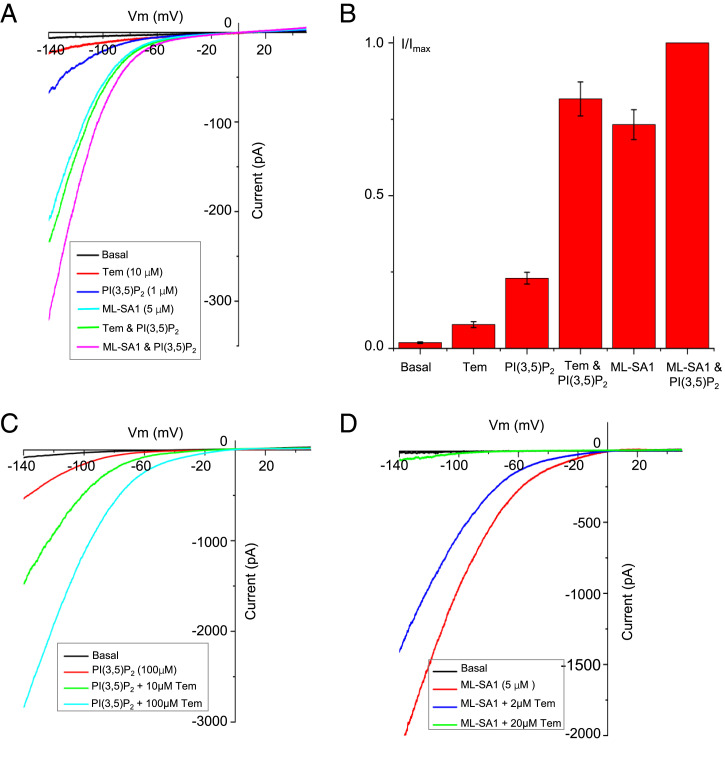
Electrophysiology of TRPML1 activation. (A) Sample traces of TRPML1 activation recorded using a patch clamp in inside-out configuration with various ligands introduced into the bath solution (cytosolic). All traces were obtained from the same patch. The same ligand concentration was used when applied individually or as a mixture. (B) Comparison of TRPML1 currents at −140 mV elicited by the individual or mixed ligands shown in A. Currents are normalized against the current elicited by the mixed ligands of ML-SA1 (5 µM) and PI(3,5)P2 (1 μM). Data points are mean ± SEM (n = 5 independent experiments). (C) Sample traces of TRPML1 activation recorded using a patch clamp in whole-cell configuration with 100 µM PI(3,5)P2 in the pipette (cytosolic). Tem was introduced into the bath solution (extracellular/luminal). The basal current was recorded right after membrane breakthrough. The PI(3,5)P2-activated current was recorded about 3 min after membrane breakthrough, allowing the lipid ligand to diffuse into the cell and yield a stable current. (D) Inhibition of ML-SA1 activation by Tem recorded using a patch clamp in whole-cell configuration in the absence of PI(3,5)P2. ML-SA1 and Tem were both introduced into the bath solution (extracellular/luminal).

