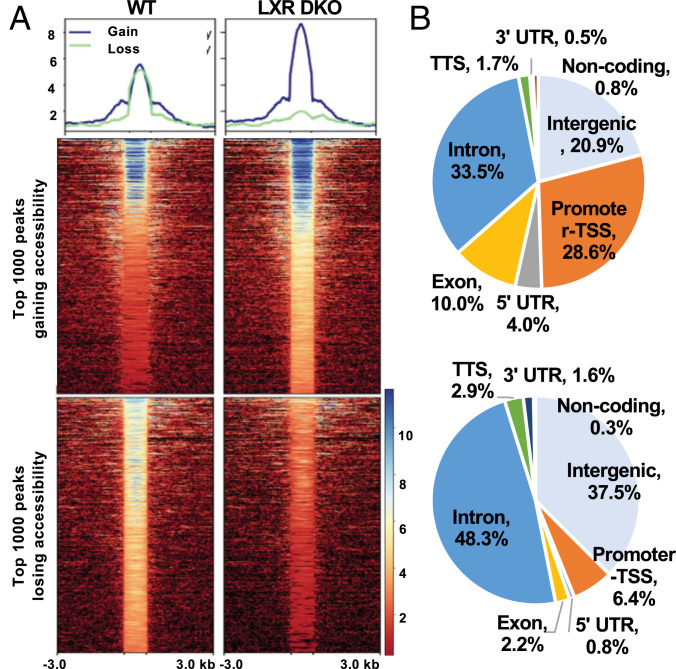
Fig. 1.
Global chromatin accessibility changes in LXRDKO liver. (A, Top) Average normalized ATAC-Seq signal intensity for top 1,000-ranked peaks changing in accessibility in WT and LXRDKO samples. (Bottom) Heatmap of signal distribution around ATAC-Seq peak summits, for the same peaks. (B) Pie charts showing distribution of genomic features among the top 1,000 peaks with largest loss and gain in LXRDKO liver.

