Fig. 3.
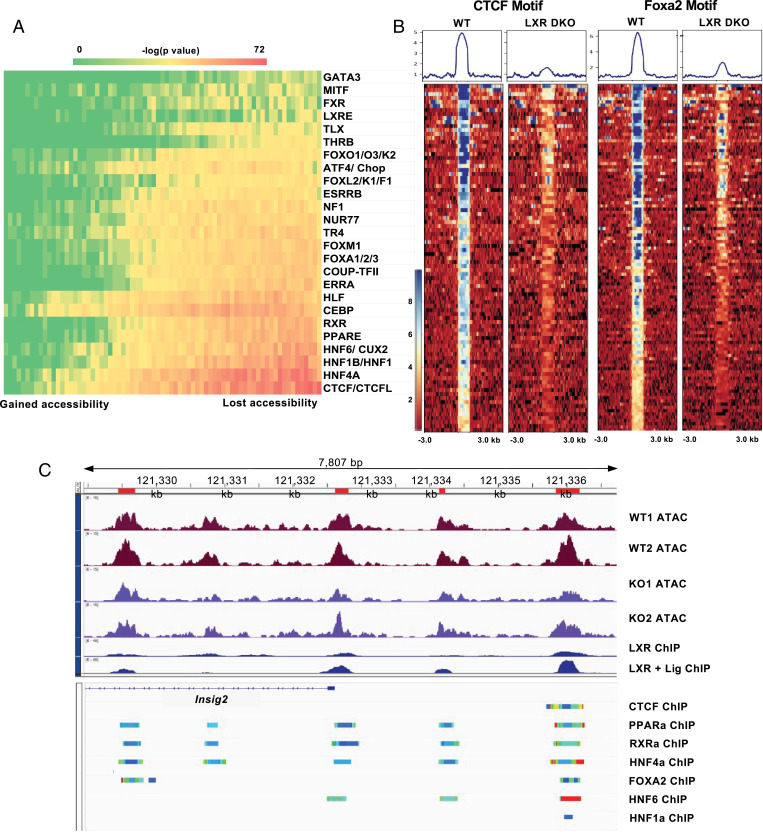
Loss of LXR affects chromatin accessibility at other transcription factor–binding sites. (A) Heatmap of motif accessibility across all ATAC-Seq peaks ranked and binned based on the accessibility difference between LXRDKO and WT samples. Shown are 73 bins each containing ∼1,000 peaks. The heatmaps represent the enrichment P value obtained from known motif analysis. Transcription factors are grouped based on motif similarity (>90%). Only motifs that were enriched in peaks that lost accessibility in LXRDKO liver are shown. (B) ATAC-Seq signal intensity heatmap and profiles across peaks associated with CTCF (Left), and FoxA2 (Right) motifs, among the top 1,000 peaks losing accessibility in LXRDKO livers. (C) Browser view of Insig2 locus showing WT and LXRDKO ATAC-Seq normalized signal alongside LXR ChIP-Seq data (27). Below the reference gene are ChIP-Atlas tracks presenting aggregate liver ChIP-Seq data for selected transcription factors (74).

