Fig. 4.
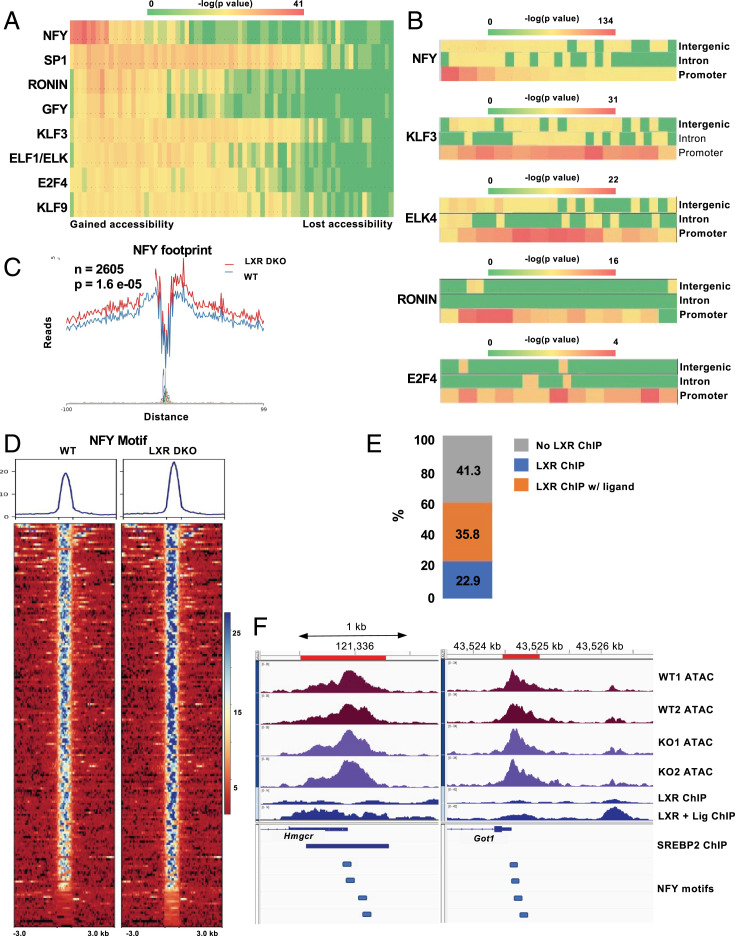
Increased accessibility of NF-Y motifs in LXR-deficient liver. (A) Heatmap of motif accessibility across all ATAC-Seq peaks ranked and binned based on differences between LXRDKO and WT. Shown are 73 bins each containing ∼1,000 peaks. The heatmap represents the enrichment P value obtained from known motif analysis. Transcription factors are grouped based on motif similarity (>90%). Only motifs that were enriched in peaks that gained accessibility in LXRDKO liver are shown. (B) Heatmaps of motif enrichment of selected overrepresented transcription factors across binned intergenic, intronic, and promoter ATAC-Seq peaks based on change in accessibility. (C) Footprint of the NF-YA motif in WT and LXRDKO ATAC-Seq samples using HINT-ATAC. (D) ATAC-Seq signal intensity heatmap and profile of peaks with NF-Y motif among the top 1,000 peaks with the largest gains of accessibility. (E) Within the top 1,000 peaks that gained accessibility in LXRDKO, proportion of genes with increased NF-Y motif accessibility that also have LXR binding. (F) Browser view of peaks with increased NF-Y motif accessibility, including the promoter regions of Hmcgr (Left) and Got1 (Right). Publicly available SREBP2 liver ChIP-Seq and NF-Y motif locations are aligned below the gene annotation (77).

