Fig. 2.
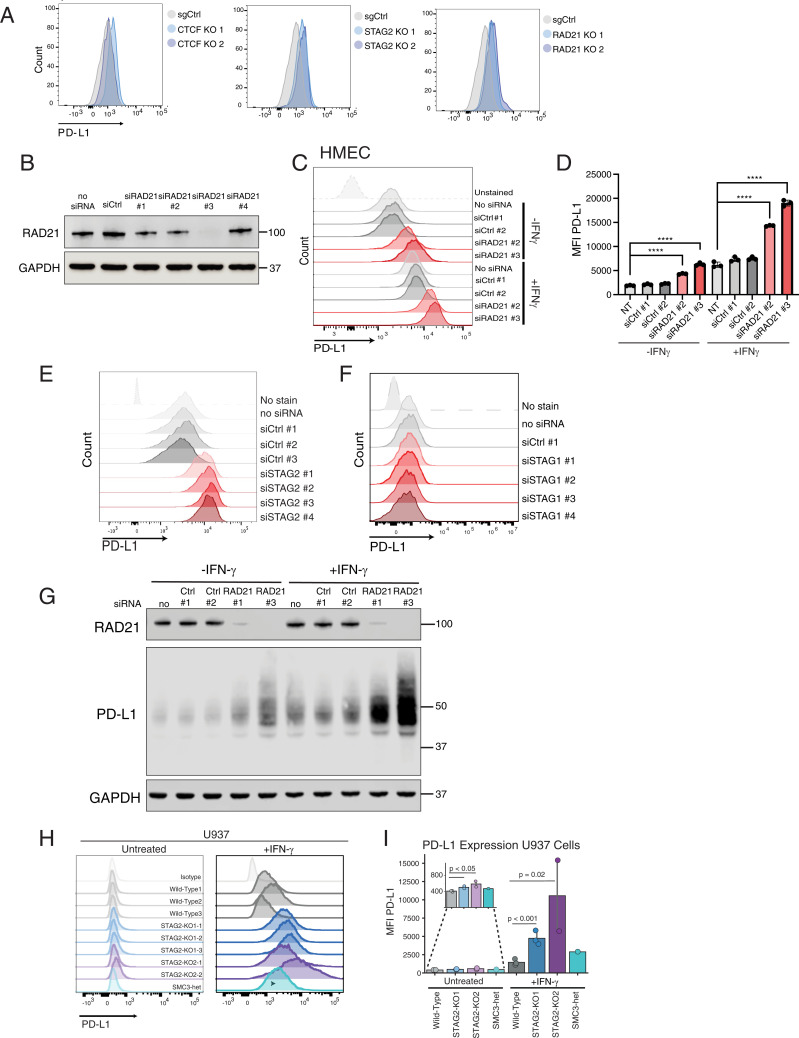
CTCF and cohesin suppress PD-L1 expression levels. (A) FACS analysis of PD-L1 cell surface expression after CRISPR-Cas9 mutation of CTCF, STAG2, and RAD21 in HMECs compared to cells treated with targeting sgAAVS1 sgRNA control (sgCtrl). (B) Western blot demonstrating successful generation of RAD21-depleted HMECs using four different siRNAs compared to cells infected with negative control scrambled siRNA and no siRNA control. (C) FACS analysis of PD-L1 expression in control and RAD21 siRNA–depleted HMECs cultured in the presence and absence of 20 ng/mL IFN-γ for 24 h prior to FACS analysis. (D) MFI of PD-L1 staining in siRAD21-treated HMECs from three biological replicates. One-way ANOVA with Dunnett’s correction was used to calculate differences between means (****P value < 0.0001) of each group and no siRNA control for each condition (untreated, +IFN-γ). Data are represented as the means ± SD. (E) FACS analysis of cell surface PD-L1 expression in control and STAG2 siRNA–depleted HMECs. (F) FACS analysis of cell surface PD-L1 expression in control and STAG1 siRNA–depleted HMECs. (G) Western blot analysis of RAD21, PD-L1, and GAPDH protein expression in control and RAD21 siRNA–depleted HMECs in the presence and absence of 20 ng/mL IFN-γ. (H) FACS analysis of PD-L1 cell surface expression in WT, STAG2-mutant (STAG2 KO1-1,2,3, STAG2 KO2-1,2) and SMC3 heterozygous (SMC3-het) U937 cells cultured in the presence or absence of 2,000 IU/mL IFN-γ for 72 h. (I) MFI of PD-L1 staining in STAG2-mutant, SMC3-het, and WT control cells quantified from replicates shown in H. Kruskal–Wallis H test (P = 0.013) with post hoc analysis was used to determine significance between groups.

