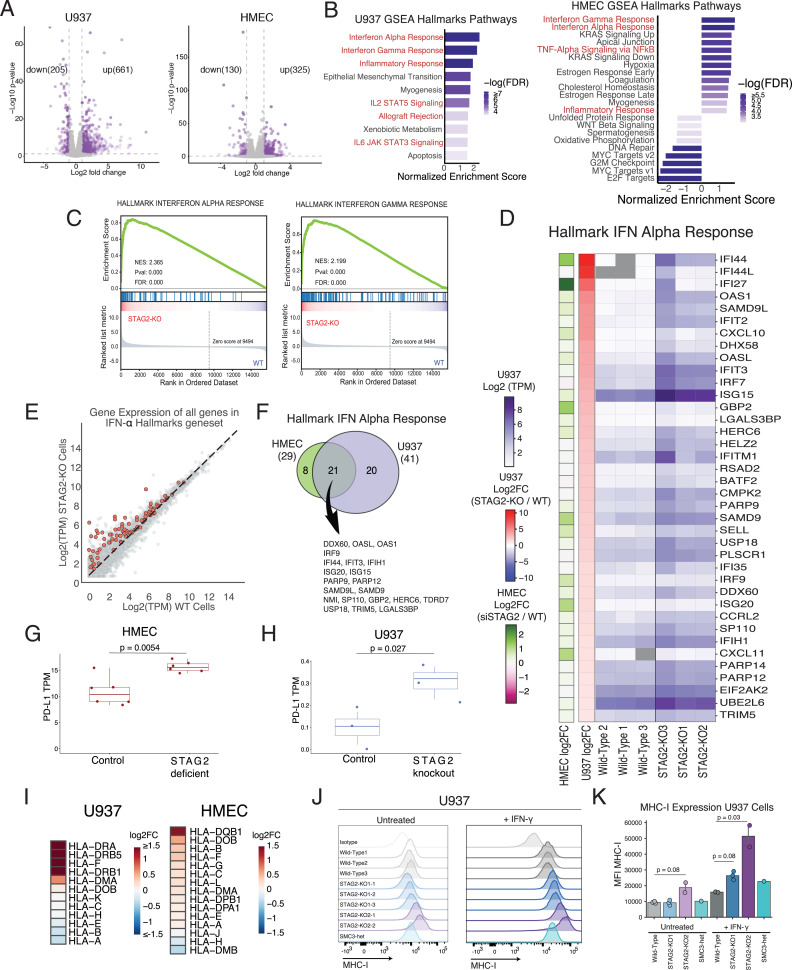
Fig. 3.
Cohesin deficiency results in up-regulation of IFN transcriptional signature. (A) Volcano plots of the RNA-seq analysis in STAG2 siRNA-depleted and control HMECs, and STAG2-mutant and WT U937 cells. Log2FC and P values calculated with DESeq2. Down-regulated and up-regulated genes (absolute value of log2FC > 1 and P value < 0.05) depicted in purple. (B) GSEA hallmark gene sets enriched or depleted in the RNA-seq analysis of STAG2-mutant and WT control U937 cells and control and siSTAG2-treated HMECs (FDR < 0.05). Immune-related pathways are highlighted in red. (C) Top two enriched GSEA hallmark gene sets in the RNA-seq analysis of STAG2-mutant and WT control U937 cells showing up-regulation of IFN-α and IFN-γ pathway in STAG2-mutant cells. (D) Heatmap of gene expression (TPM values in purple and log2FC values in red-blue) for genes in the IFN-α expression signature with absolute value of log2FC >1 between the STAG2-mutant and WT U937 control cells. Log2FC changes in siSTAG2 HMECs compared to controls depicted in green-pink. (E) Gene expression [Average Log2(TPM)] of STAG2-mutant and WT control cells with genes present in IFN-α gene set highlighted in red and all other genes colored in gray. (F) Overlap between the genes in the IFN-α hallmark gene set enriched in the RNA-seq analysis of STAG2-mutant U937 and STAG2-deficient HMECs (log2FC > 0.2 and P value < 0.05). (G) TPM values of PD-L1 in RNA-seq analysis of STAG2-deficient and control HMECs. Student’s t test was used to calculate differences between means. (H) TPM values of PD-L1 in RNA-seq analysis of STAG2-mutant and control U937 cells. Student’s t test was used to calculate differences between means. (I) Heatmap showing the log2FC of mRNA expression levels of HLA genes in STAG2-mutant U937 and STAG2 HMECs determined by RNA-seq analysis. (J) Flow cytometry analysis of MHC-I expression in WT, STAG2-mutant (STAG2 KO1-1,2,3, STAG2 KO2-1,2), and SMC3-heterozygous (SMC3-het) U937 cells in the presence and absence of IFN-γ treatment (2,000 IU/mL for 72 h). Staining with the isotype antibody shown as a control. (K) Quantification of MFI of MHC-I expression in J. Kruskal–Wallis H test (P = 0.016) with post hoc analysis was used to determine significance between groups.

