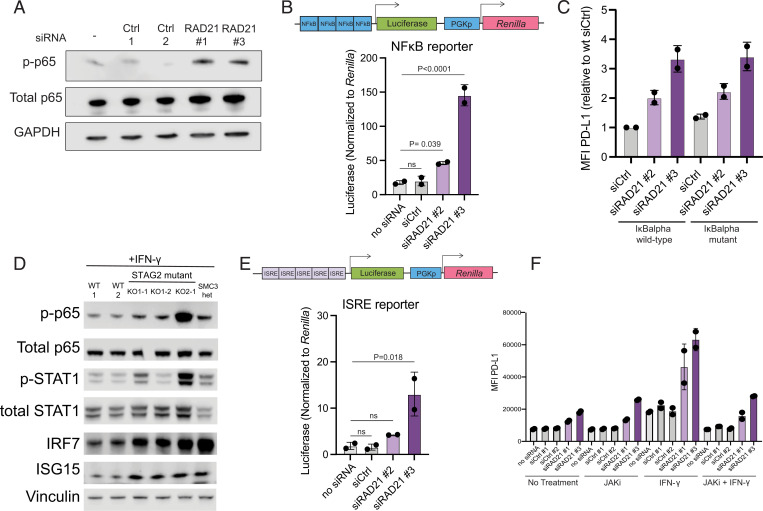
Fig. 4.
Cohesin mutations result in activation of JAK-STAT signaling and NF-κB. (A) Western blot analysis of p-p65, p65, and GAPDH loading control in siRAD21 or control HMECs. (B) Firefly luciferase quantification of NF-κB luciferase reporter normalized to Renilla luciferase in control and siRAD21-treated HMECs. One-way ANOVA with Dunnett’s correction analysis was used to calculate differences between means of each group and no siRNA control. (C) FACS analysis of PD-L1 cell surface levels in IκBα superrepressor mutant-expressing cells or IκBα WT-expressing HMECs treated with siRAD21 or control siRNA. (D) Western blot analysis of components of the NF-κB (p-p65 and total p65) and IFN response (p-STAT1, STAT1, IRF7, and ISG15) pathways in STAG2-mutant and SMC3-heterozygous U937 cells. (E) Firefly luciferase quantification of ISRE luciferase reporter normalized to Renilla luciferase in control and siRAD21-treated HMECs. One-way ANOVA with Dunnett’s correction analysis was used to calculate differences between means of each group and no siRNA control. (F) FACS analysis of PD-L1 cell surface levels in control or siRAD21-treated HMECs treated with JAKi (0.5 μM for 48 h), IFN-γ (20 ng/mL for 24 h), or combination of JAKi and IFN-γ treatment. MFI of PD-L1 surface staining is plotted on the y-axis. Data are represented as the means ± SD in all panels.

