
FIGURE 3.
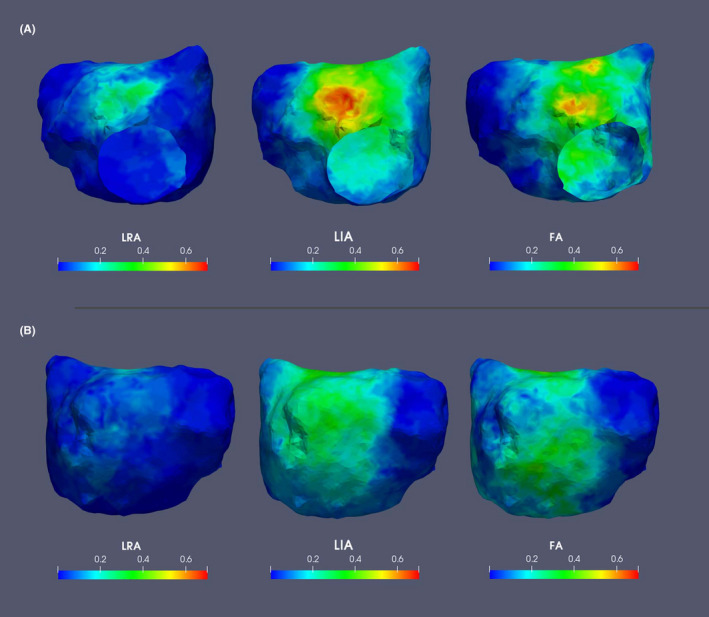
Composite images demonstrating spatial distribution and frequency (normalized to scale 0–1) of CDA, for all patients displayed on a common geometry; (A) AP and (B) PA views. CDA, charge density activation; FA, focal activity; LIA, local irregular activity; LRA, local rotational activity