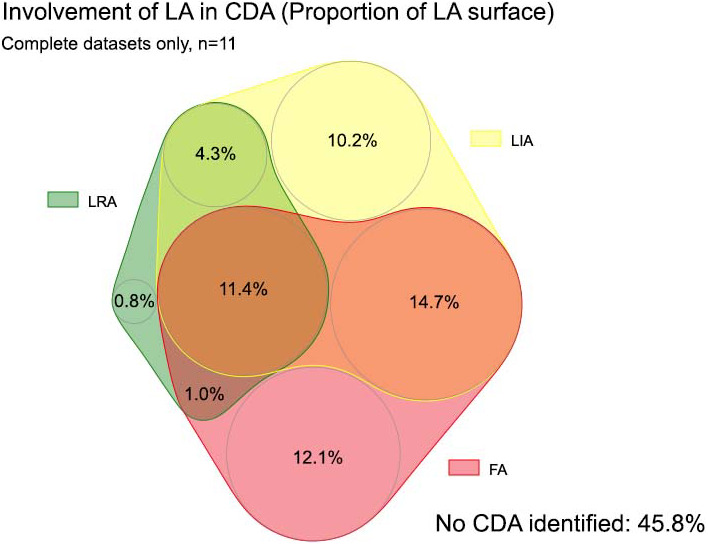
FIGURE 4.

Venn diagram demonstrating the involvement of left atrium (percentage of LA area) and degree of spatial overlap between charge density activity, complete datasets only. CDA, charge density activation pattern comprising LRA (local rotational activity); LIA, local irregular activity and FA, focal activity
