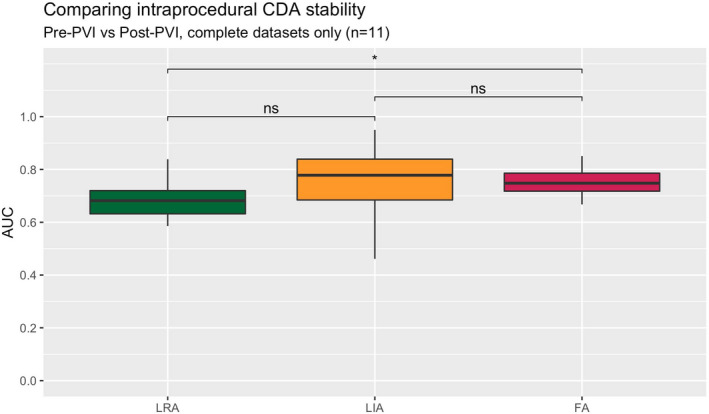
FIGURE 7.

Long‐term temporal stability expressed as AUC (comparing 30 s maps from the pre‐PVI and post‐PVI recordings), complete datasets only. Pairwise comparisons with Wilcoxon signed‐rank (ns = not significant, *p < .05). AUC, area under the curve metric; CDA, charge density activation pattern comprising LRA (local rotational activity); FA, focal activity; LIA, local irregular activity; PVI, pulmonary vein isolation
