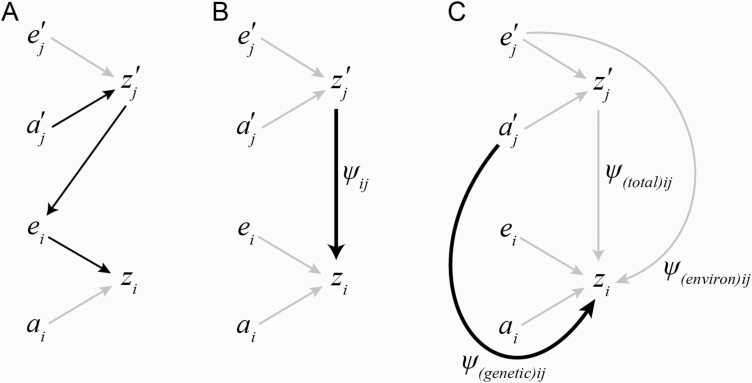
Figure 1.
Path diagrams illustrating the components of ψ and their relationship to IGEs. Detailed explanations are provided in the Box text. (A) Causal path diagram of an IGE: genes in interacting individuals influence expression of interacting partners’ phenotypes, interacting partner’s phenotypes are a component of the environment of focal individuals; thus, indirect genetic effects influence focal trait expression (after Wolf et al. 1998). (B) The phenotypic association between interacting and focal partner phenotypes is commonly understood to represent ψ (after Moore et al. 1997). (C) Typical measurements of the interaction coefficient do not distinguish effects arising from additive genetic versus environmental components of the interacting partner trait, but attempt to control this by eliminating or randomly distributing environmental effects while systematically varying additive genetic effects. However, environmental effects may not be randomly distributed or independent from the focal phenotype, potentially biasing the estimation of ψ.

