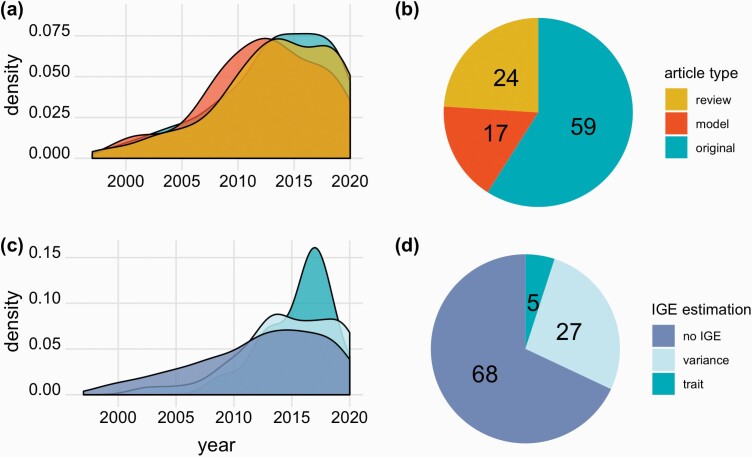
Figure 3.
Distributions and types of 463 articles citing Moore et al. (1997), assessed in March 2021. (A) Density distribution of the three different article types per year illustrating relative differences in publications over time. (B) Pie chart showing the percentages of each article type. (C, D) Distributions of the approaches of IGEs estimations in original articles citing Moore et al. (1997) illustrating relative differences in publications over time. (C) Density distribution of the IGE estimation approach per year. (D) Pie chart showing the percentages of each IGEs estimation approach. The year 2021 was removed from the density distributions as it biases distributions towards lower values.

