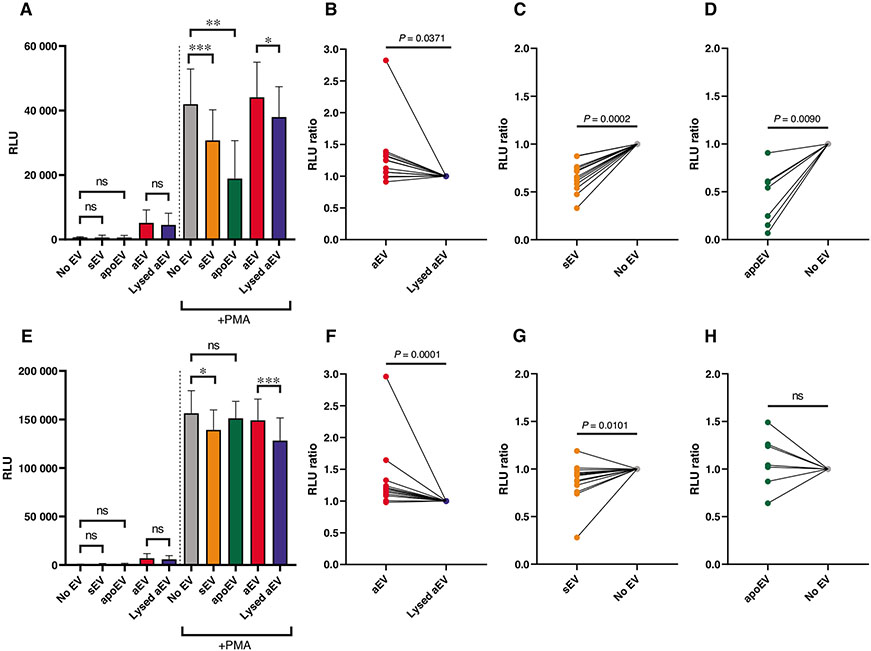
FIGURE 2. Effect of EVs on the ROS production of PMN.
PMNs were pretreated for 45 min with the indicated EV or control, then left unstimulated or activated with 100 nM PMA. ROS production was determined at 10 min after activation (A–D) and at the peak intensity of the curve, typically at 30 to 40 min (E–H). Panels (A) and (E) show the summarized ROS production of the EV-pretreated PMN, (B–D) and (F–H) show the normalized data pairs from each experiment. Data were normalized to their adequate controls (“aEV” to “Lysed aEV,” “sEV” and “apoEV” to “No EV”). Raw data were compared using paired Student’s t-test; n = 13 for aEV and sEV; n = 7 for apoEV. Error bars represent mean + SEM

