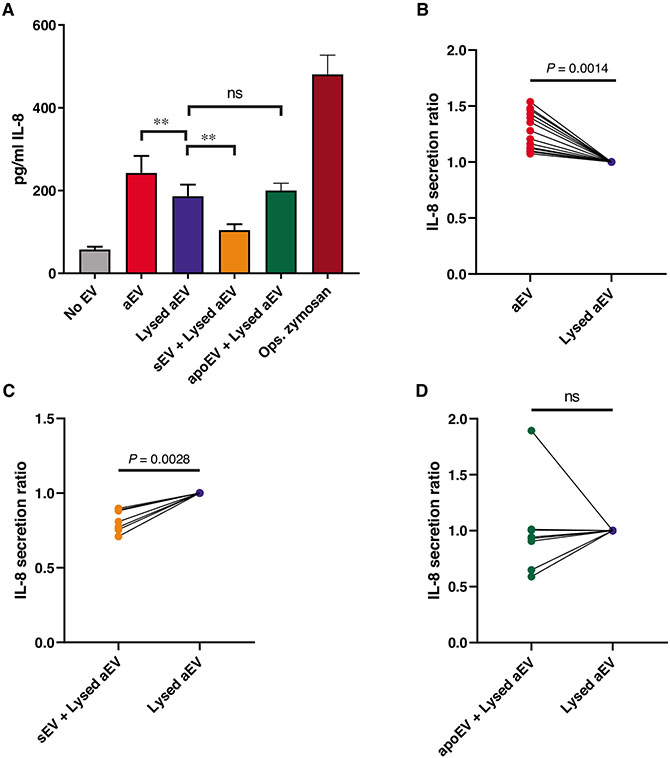
FIGURE 3. Effect of EVs on the IL-8 production of PMN.
PMNs were treated for 3 h with 1 of the 3 EV populations or their controls. IL-8 amount of the supernatant was quantified with ELISA. Panel (A) shows the summarized changes in IL-8 production of the EV-treated cells. Panels (B)–(D) show the normalized data pairs from each experiment. Data were normalized to their adequate controls (“aEV” to “Lysed aEV,” “sEV” and “apoEV” to “No EV”). Raw data were compared using paired Student’s t-test; n = 15 for aEV; n = 7 for sEV; n = 8 for apoEV. Error bars represent mean + SEM

