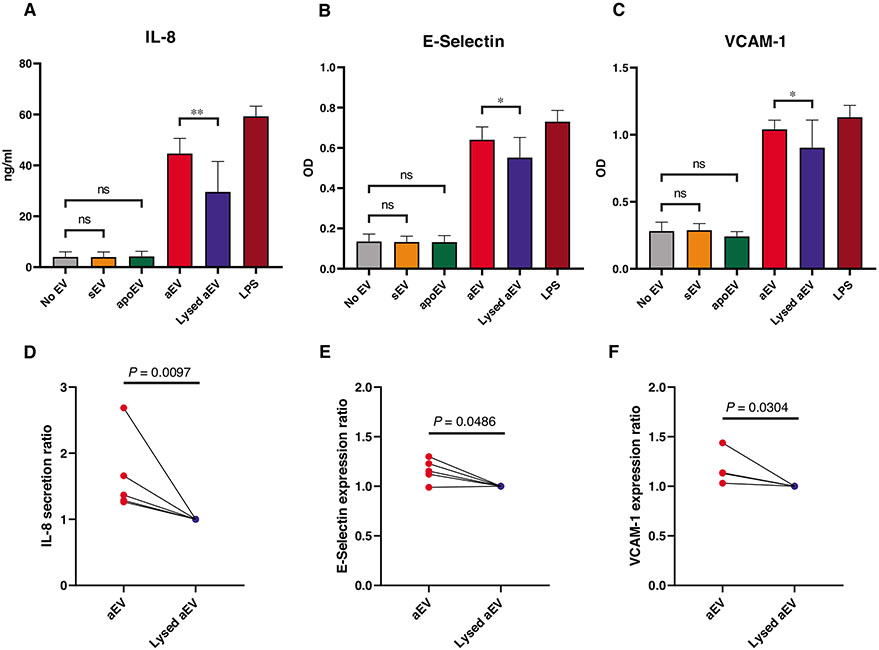
FIGURE 4. Effect of EVs on endothelial cells.
HUVEC were pretreated for 6 h (E-Selectin) or 24 h (VCAM-1 and IL-8) with 1 of the 3 EV populations or their controls. IL-8 amount of the supernatant was quantified with ELISA (A and D). E-Selectin and VCAM-1 expression was determined by cellular ELISA (B, C, E, and F). Panels (A)–(C) show the summarized changes in IL-8 secretion, E-Selectin, and VCAM-1 expression of the EV-treated cells. Panels (D)–(F) show the normalized data pairs for aEV or control-treated cells from each experiment. Data were normalized to their adequate controls (“aEV” to “Lysed aEV”, “sEV” and “apoEV” to “No EV”). Raw data were compared using paired Student’s t-test; n = 5. Error bars represent mean + SEM

