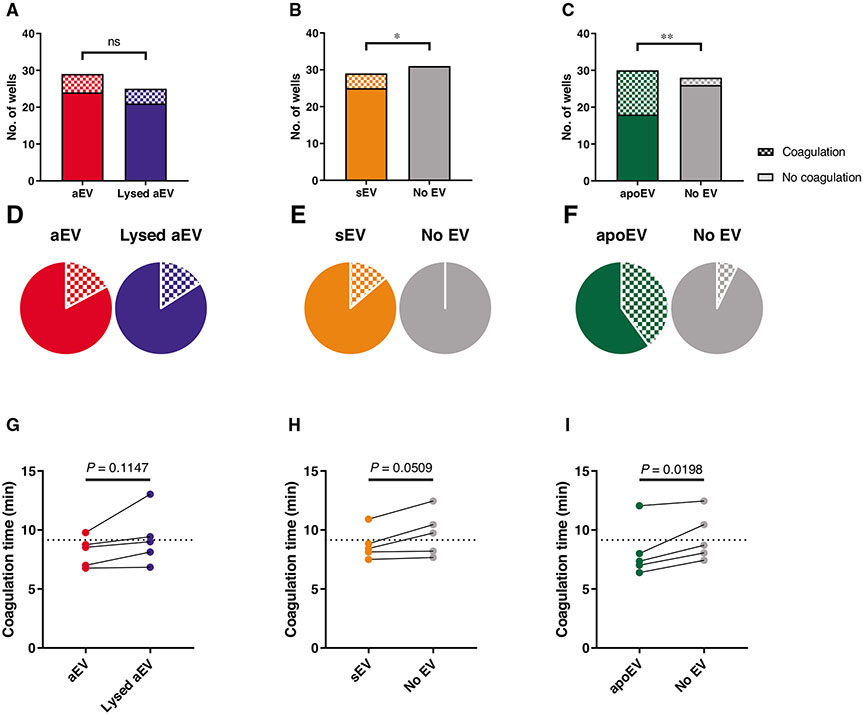
FIGURE 5. Effect of EVs on coagulation.
One of the 3 EV populations or their controls were mixed with pooled citrated human plasma in the absence (A–F) or presence (G–I) of thromboplastin followed by recalcification with Ca-HEPES. Panels (A)–(C) show the absolute numbers of coagulated and not coagulated wells in each sample. Panels (D)–(F) represent the percentage of coagulated wells based on the same data. Panels (G)–(I) show the time needed for 50% of the coagulation process in the thromboplastin-treated samples (raw data pairs). The dotted lines on (G)–(I) show the average coagulation time of the “No EV” samples. Data were compared using Fisher’s exact test (A–F) and paired Student’s t-test (G–I). n = 29 wells from 7 donors for aEV and sEV; n = 30 wells from 6 donors for apoEV (A–F). n = 5 from 5 donors (G–I)

