Figure 7.

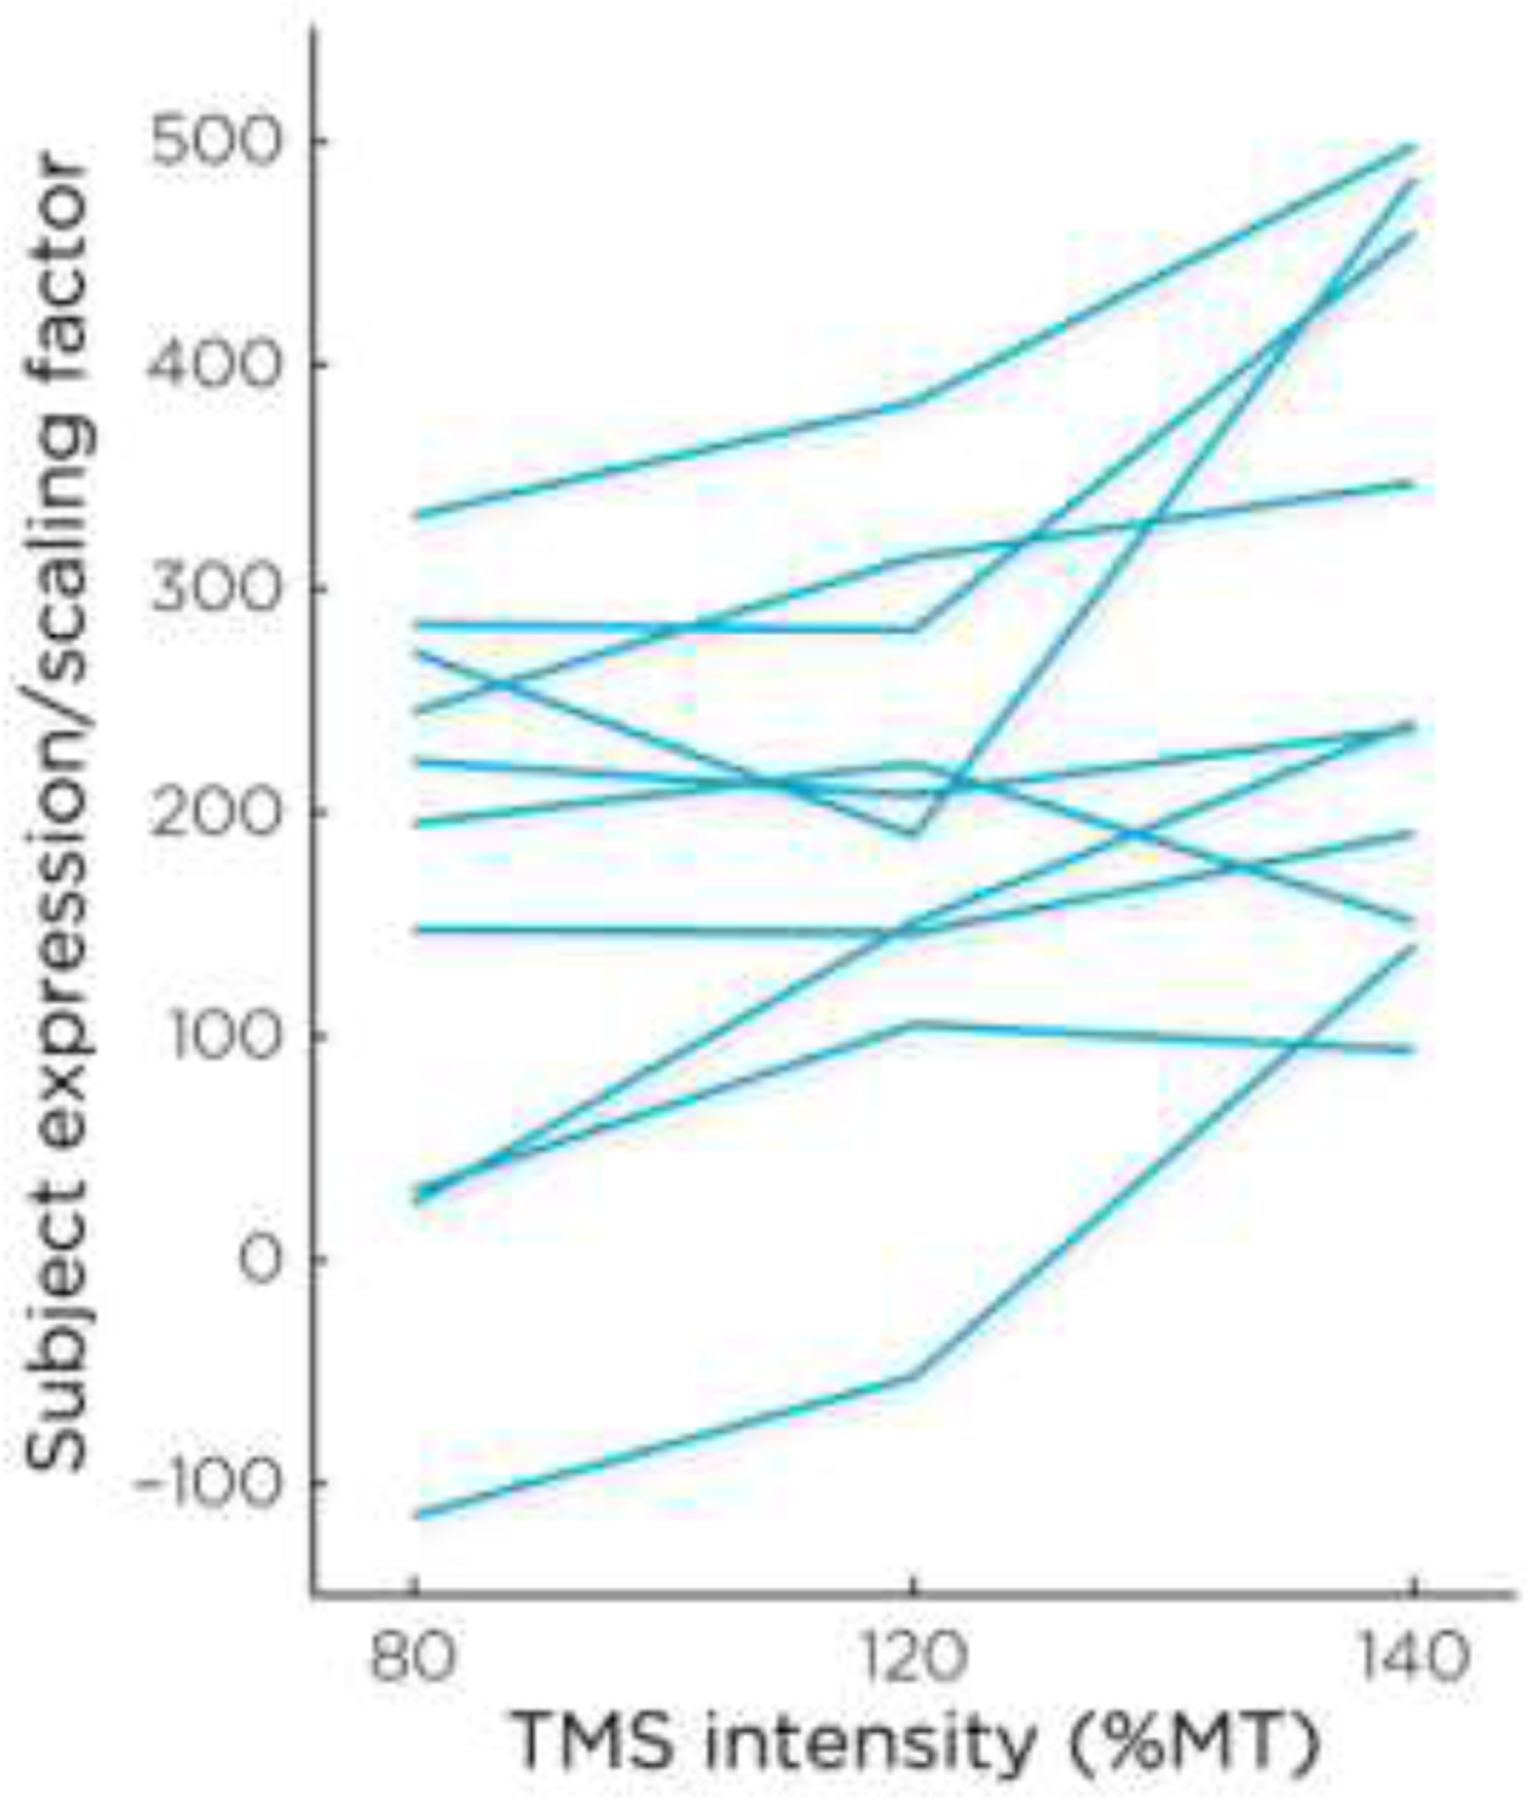
Subject scores of the best-fit model resulting from the first three principal components of the OrT Analysis. Expression of this model increased across TMS intensity (permutation test: rm- F=38.66, p< 0.03).

Subject scores of the best-fit model resulting from the first three principal components of the OrT Analysis. Expression of this model increased across TMS intensity (permutation test: rm- F=38.66, p< 0.03).