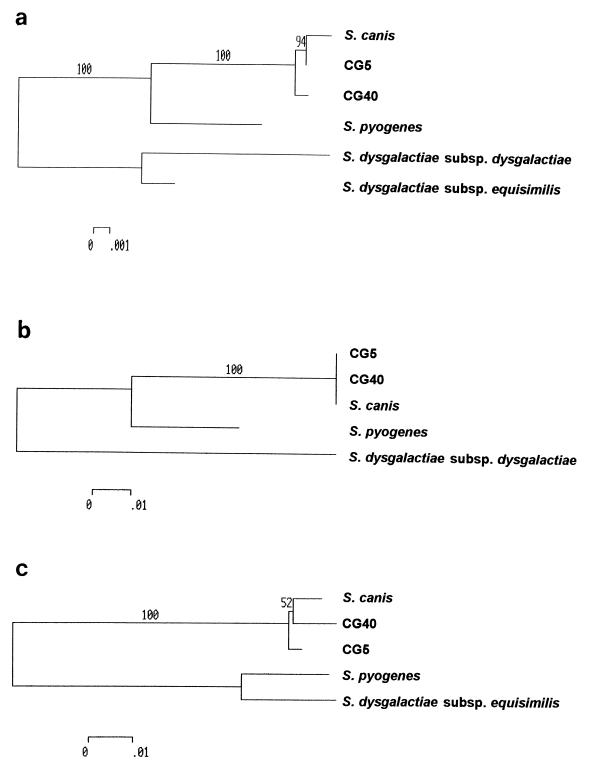
FIG. 2.
Phylogenetic trees corresponding to the sequence data shown in Fig. 1: 16S rRNA gene (A); sodA (B); mutS (C). Analysis was performed using the MEGA package, and trees were constructed using the neighbor-joining method with the Jukes-Cantor correction. The percent bootstrap confidence levels of internal branches were calculated from 500 resamplings of the original sequence data.

