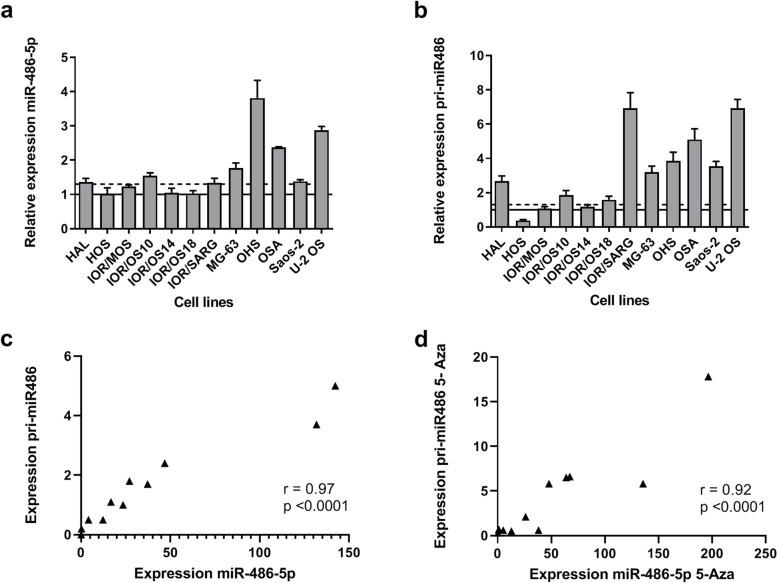
Fig. 2.
Expression and correlation of miR-486-5p and hsa-mir-486-1 (pri-mir486) in osteosarcoma cell lines upon 5-Aza-2′-deoxycytidine treatment. Relative expression level A. miR-485-5p and B. pri-mir486 after 72 h of 5-Aza treatment. The values are shown relative to treated cell lines (set to 1, horizontal line). Induction of > 30% shown as dotted line. Values are given as mean (SD). Correlation between expresion level of miR-485-5p and pri-mir486 in C. untreated and D. 5-Aza treated cell lines. The expression levels are quantified using qRT-PCR, and normalized against RNU44 for miR-486-5p and GAPDH for pri-mir486

