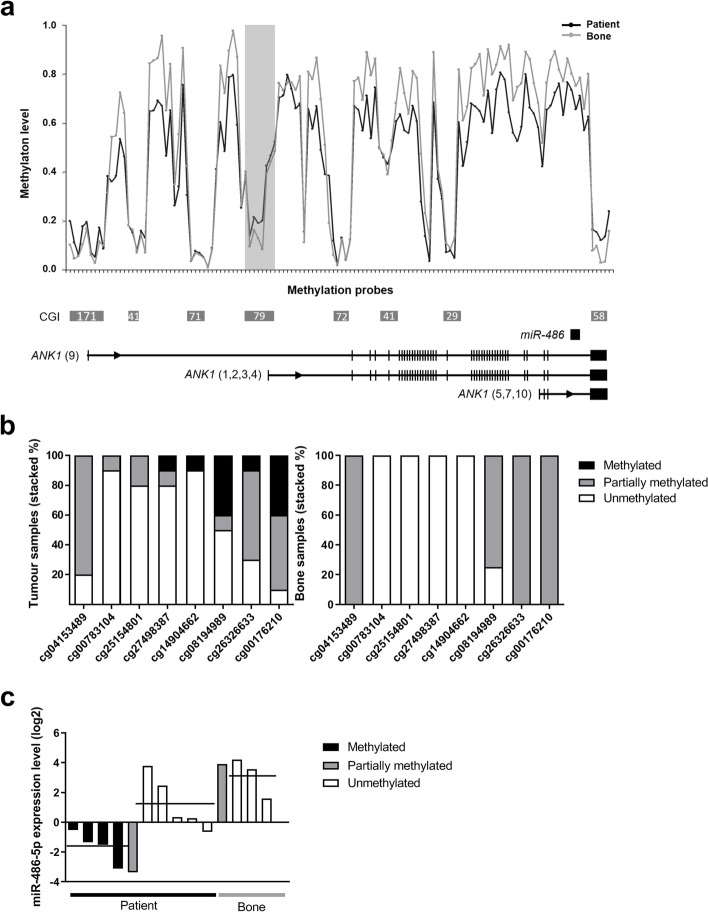
Fig. 4.
Genome-wide methylation profile of the mir-486/ANK1 locus and miR-486-5p expression levels in osteosarcoma patient samples. A. Representation of average methylation profile across the mir-486/ANK1 locus in osteosarcoma patient samples (n = 10) and bone (n = 4). Methylation level (Beta) is shown for the individual CpG sites (ticks on horizontal axis) from the HumanMethylation450 BeadChips. The probes are ordered along the locus and intervals are not in scale. CGIs are shown as grey boxes with number refering to CpG count (from UCSC Genome Browser NCBI, GRCh37/hg19 assembly). Horizontal lines below plot show representative transcript variants of the respective mRNA genes (RefSeq) with exons as vertical bars, not in scale. Shaded vertical box: CGI shown in detail in B. Black, osteosarcomas; Grey, bone. B. Probe level methylation for CGI CpG79 in osteosarcoma patient samples and bone. Methylation levels as determined by Infinium 450 k arrays are given in Beta values for the individual CpG sites (cg). The selected CpGs within CGI CpG79 are highlighted with a shaded vertical box in A. Methylated: Beta 0.7–1.0; partially methylated: Beta 0.3–0.7; unmethylated: Beta< 0.3. C. Expression level of miR-486-5p in osteosarcoma patient samples and bone based on qRT-PCR. The osteosarcoma samples are grouped based on methylation status for probe cg08194989 on Infinium 450 k arrays, while the bone samples are shown as one group. Horizontal line: mean value

