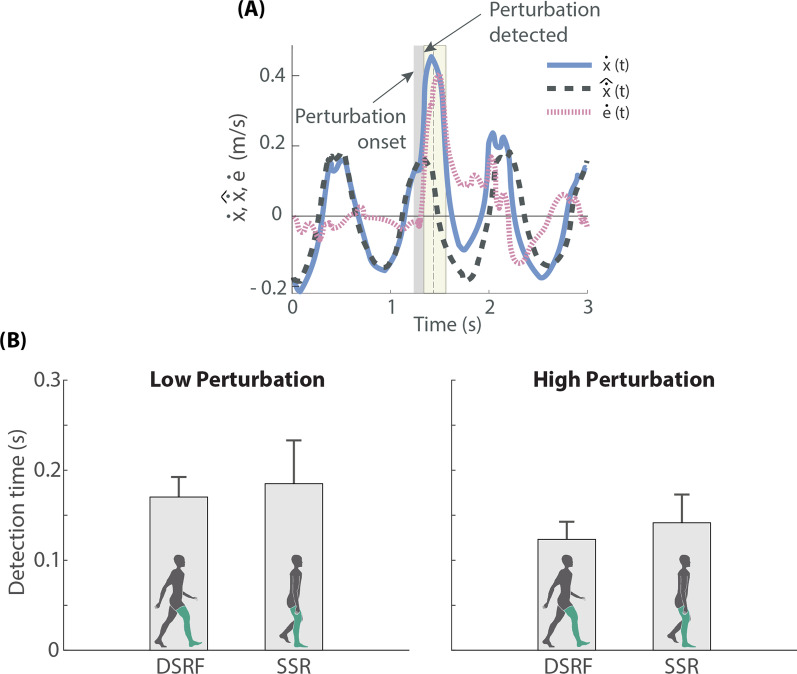
Fig. 2.
A Example of a real-time perturbation detection based on the detection algorithm described in Perturbation detection section. Vertical dark grey area represents the duration of the perturbation, and light yellow area the interval in which the robotic assistance was being triggered. B Detection times obtained during the experiment performed with 10 healthy subjects (mean ± SD), who received perturbations of two magnitudes (Low and High) at two moments of the gait cycle (DSRF double support with right leg in front, SSR single support right leg)

