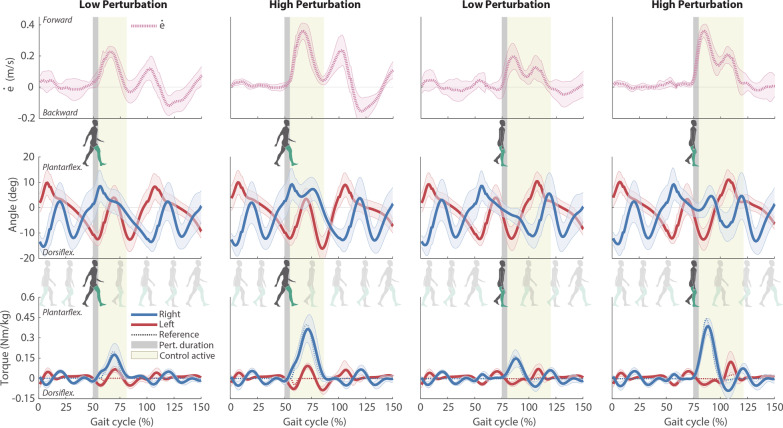
Fig. 3.
Participants’ kinematic and kinetics data (mean values ± SD) corresponding to the assistance trials and expressed with respect to the normalized gait cycles. COM velocity error calculated based on (1) is presented in the first row. Ankle joint angles (second row) and assistive joint torques (third row) are plotted in blue (right ankle) and red lines (left ankle). Reference torques computed by the controller are represented by the dotted lines (the yellow areas indicate the time period in which the controller was active). Vertical dark grey areas represent the perturbation occurrences, and light yellow areas the intervals in which the robotic assistance was being triggered

