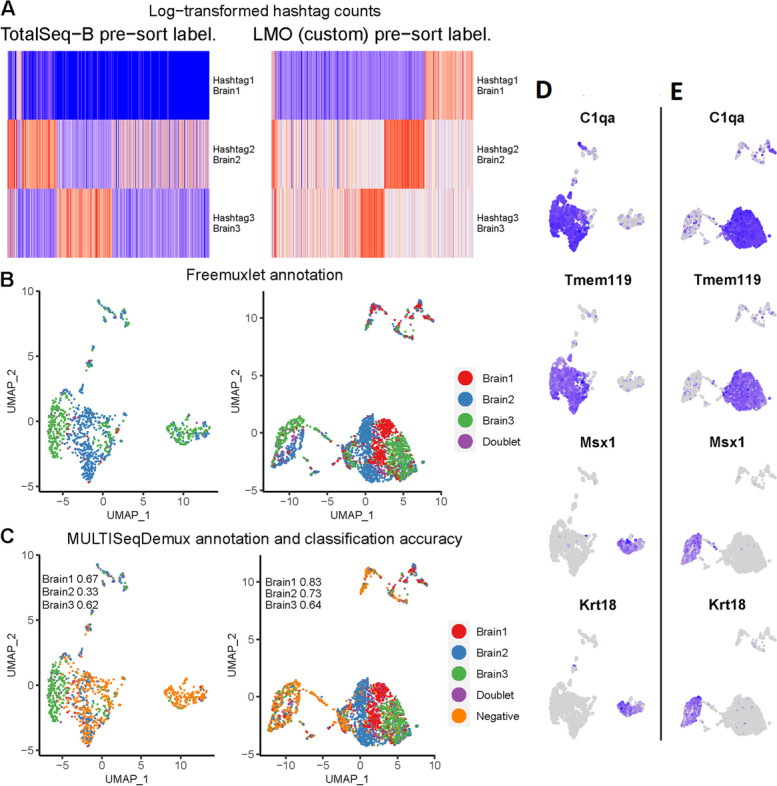
Fig. 6.

Antibody and lipid hashing of mice brain cells. Each column represents a separate hashing method. “Pre-sort labeling”—labeling with hashing reagents followed by one wash and live/dead sorting with subsequent loading of the cells on a 10x Genomics chip. A Hashtag-derived oligo (HTO) matrices were generated using CellRanger, followed by log-transformation and visualised on heatmaps. B Cell annotation (3 mice strains) was performed using freemuxlet (gene expression) and visualized on the gene expression UMAP plots. C MULTISeqDemux-annotated cells (HTO signal) were matched with the freemuxlet-annotated cells. Classification accuracy of every hashing method reported for each strain (brain cells). D Gene-cell matrices were generated using CellRanger, followed by log-transformation of gene UMI counts and cell clustering (gene expression, PCA reduction) using Seurat. The marker gene UMI counts were visualised in blue color on the gene expression UMAP plots for antibody hashing and lipid hashing (E)
