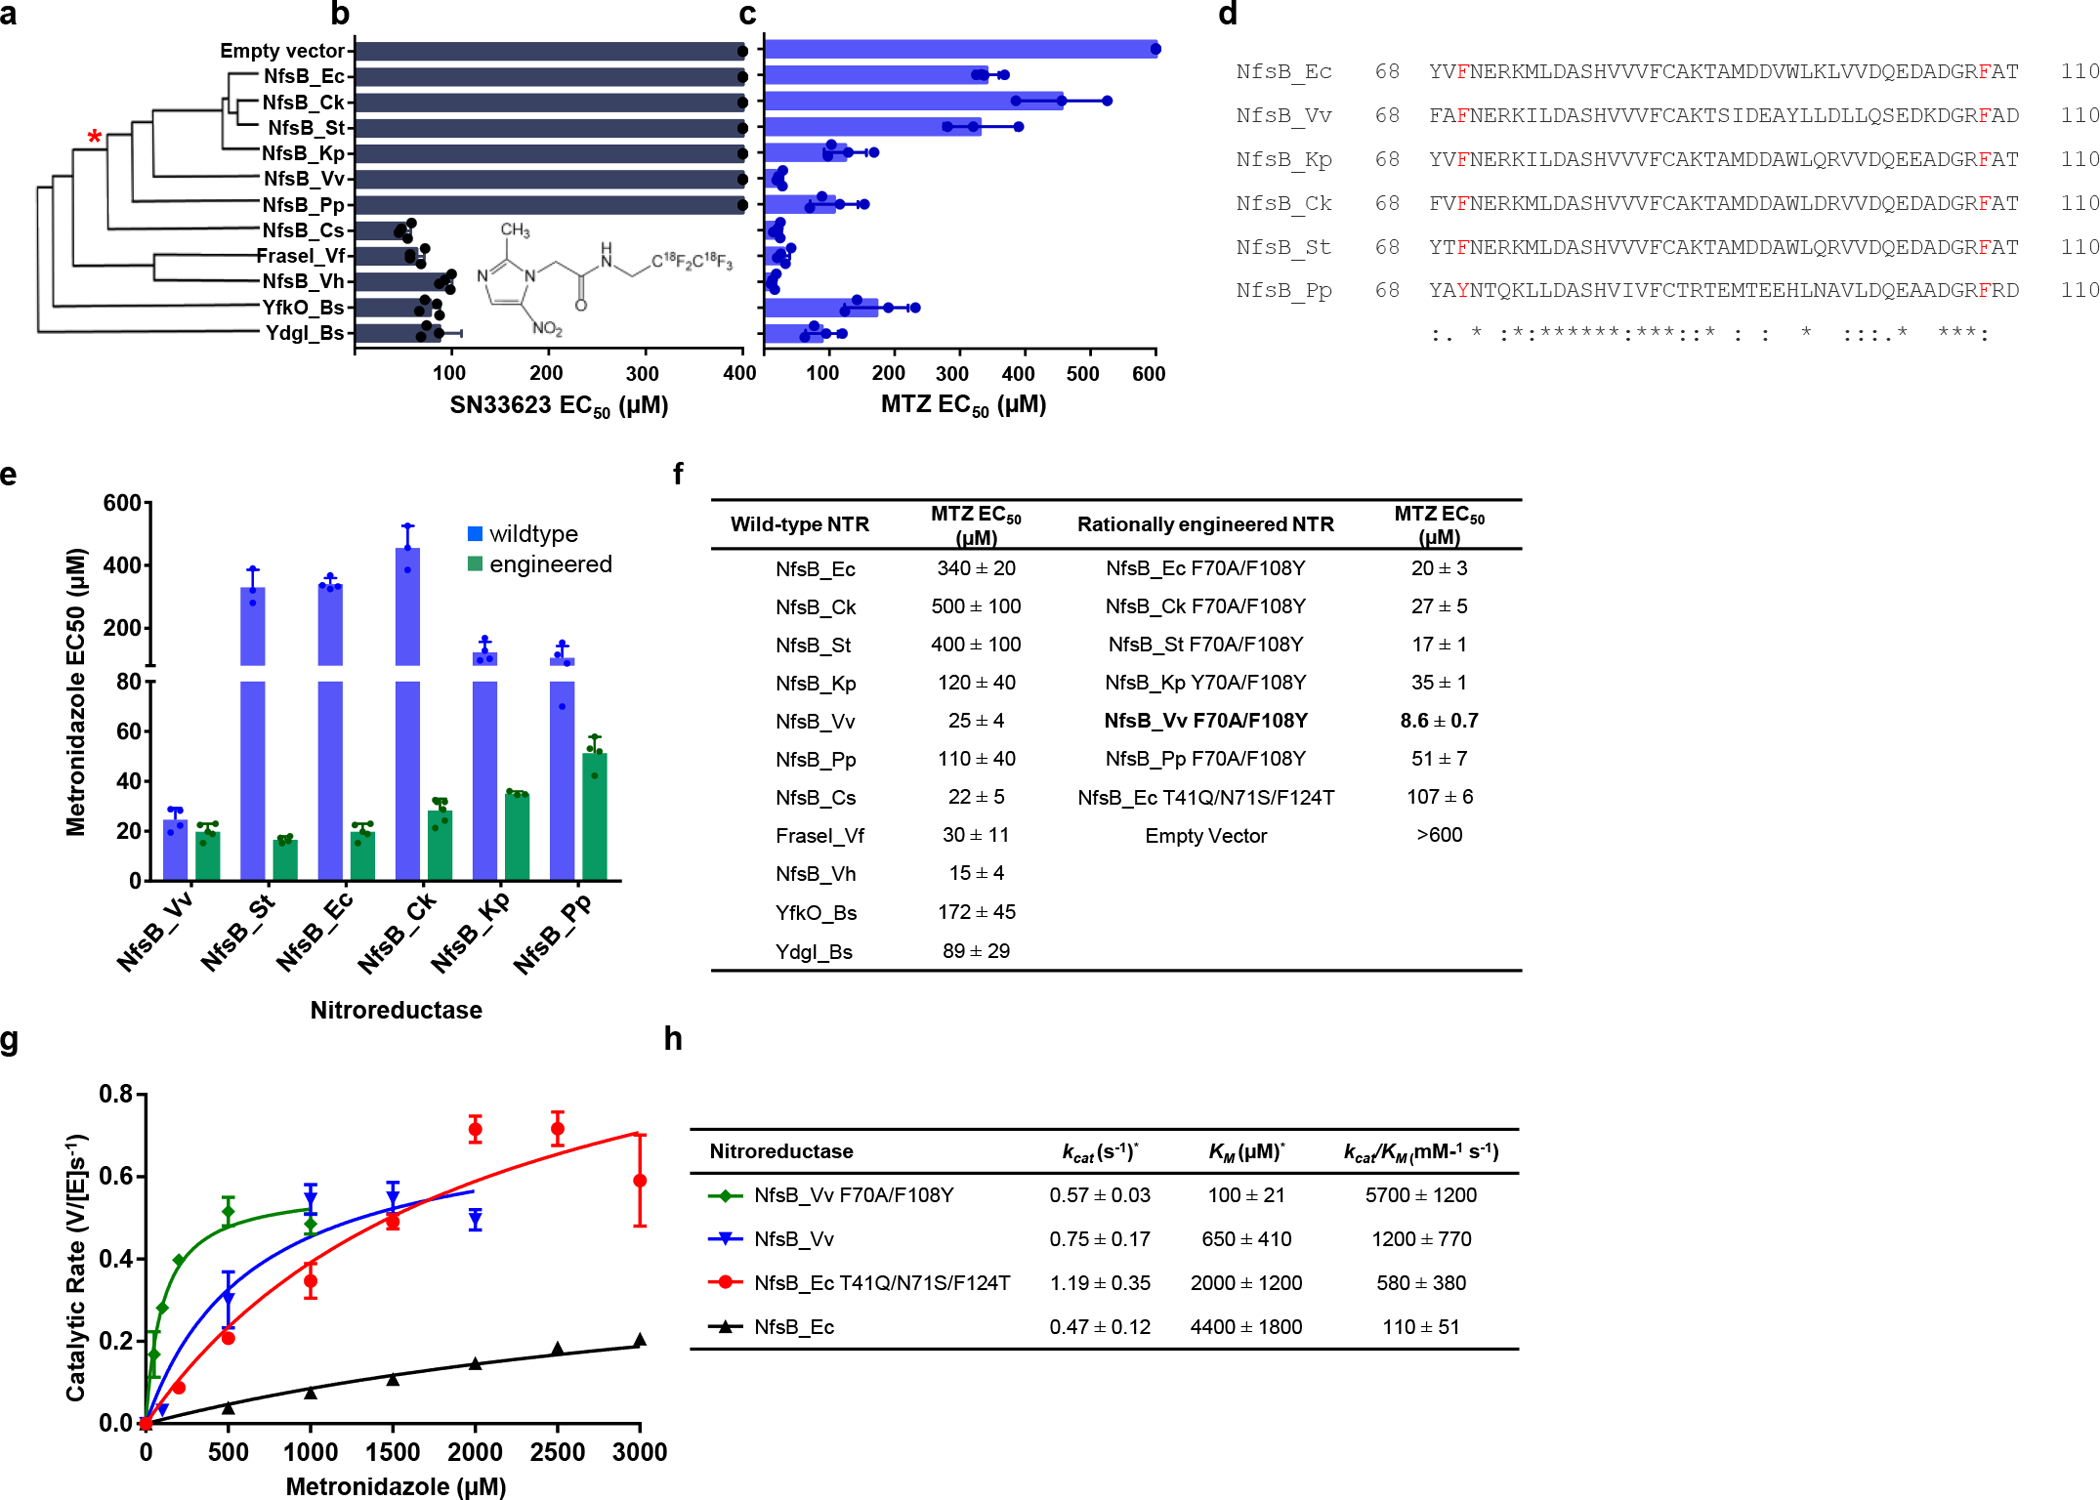
Fig. 1: Rationally engineered NfsB-family NTRs for improved activation of MTZ.

a, Amino acid sequence identity cladogram of eleven NfsB orthologs, grouped according to percent shared amino acid identity with NfsB_Ec. The asterisk (*) marks where other NTR variants diverge from NfsB_Ec-like enzymes. b, E. coli host sensitivity conferred by NfsB variants to the compound SN33623, n=3 biologically independent experiments for all strains except those expressing NfsB_Pp, NfsB_Cs, FraseI_Vf, NfsB_Vh, YfkO_Bs and YdgI_Bs (n=4). c, E. coli host sensitivity conferred by NfsB variants to the compound MTZ, n=4 biologically independent experiments for all strains except those expressing NfsB_Ck and NfsB_St (n=3). b-c, Data are means ± SD, data without error bars indicate host cell sensitivity could not be observed within the tested concentration range. Insets: chemical structures of SN33623 and MTZ. d, Identification of ‘SN33623-blocking’ residues in NfsB_Ec-like NTRs. Partial protein alignment of NfsB_Ec and NfsB_Ec-like enzymes (residues 68 – 110) with ‘SN33623 blocking’ residues highlighted in red. Identical (*), conservative (:), and semi-conservative (.) amino acid differences are indicated. e, E. coli host sensitivity to MTZ conferred by wild-type or rationally engineered NfsB-like enzymes, n=4 biologically independent experiments for all strains except those expressing NfsB_Ck, NfsB_St, and NfsB_Kp Y70A/F108Y (n=3), NfsB_Ec F70A/F108Y (n=5), and NfsB_Ck F70A/F108Y (n=8). Data are means ± SD. f, Summary of MTZ EC50 values for E. coli strains expressing wild-type or rationally engineered NTRs. g, Michaelis-Menten reaction curves of purified NTR variants with MTZ. The indicated NTR enzymes were purified and assayed for MTZ conversion activity across a concentration range spanning from ca. 0.2× to 5× the KM for each variant, n=3 biologically independent experiments. Data presented are means ± SD. h, Michaelis-Menten kinetic parameters for the reduction of MTZ by purified His6-tagged NTRs, monitored at 340 nm, n=3 biologically independent experiments. Data are means ± SD. KM and kcat values were derived using GraphPad Prism 8.0. The asterisk (*) indicates that these are apparent kinetic parameters as measured at 100 μM NADPH.
