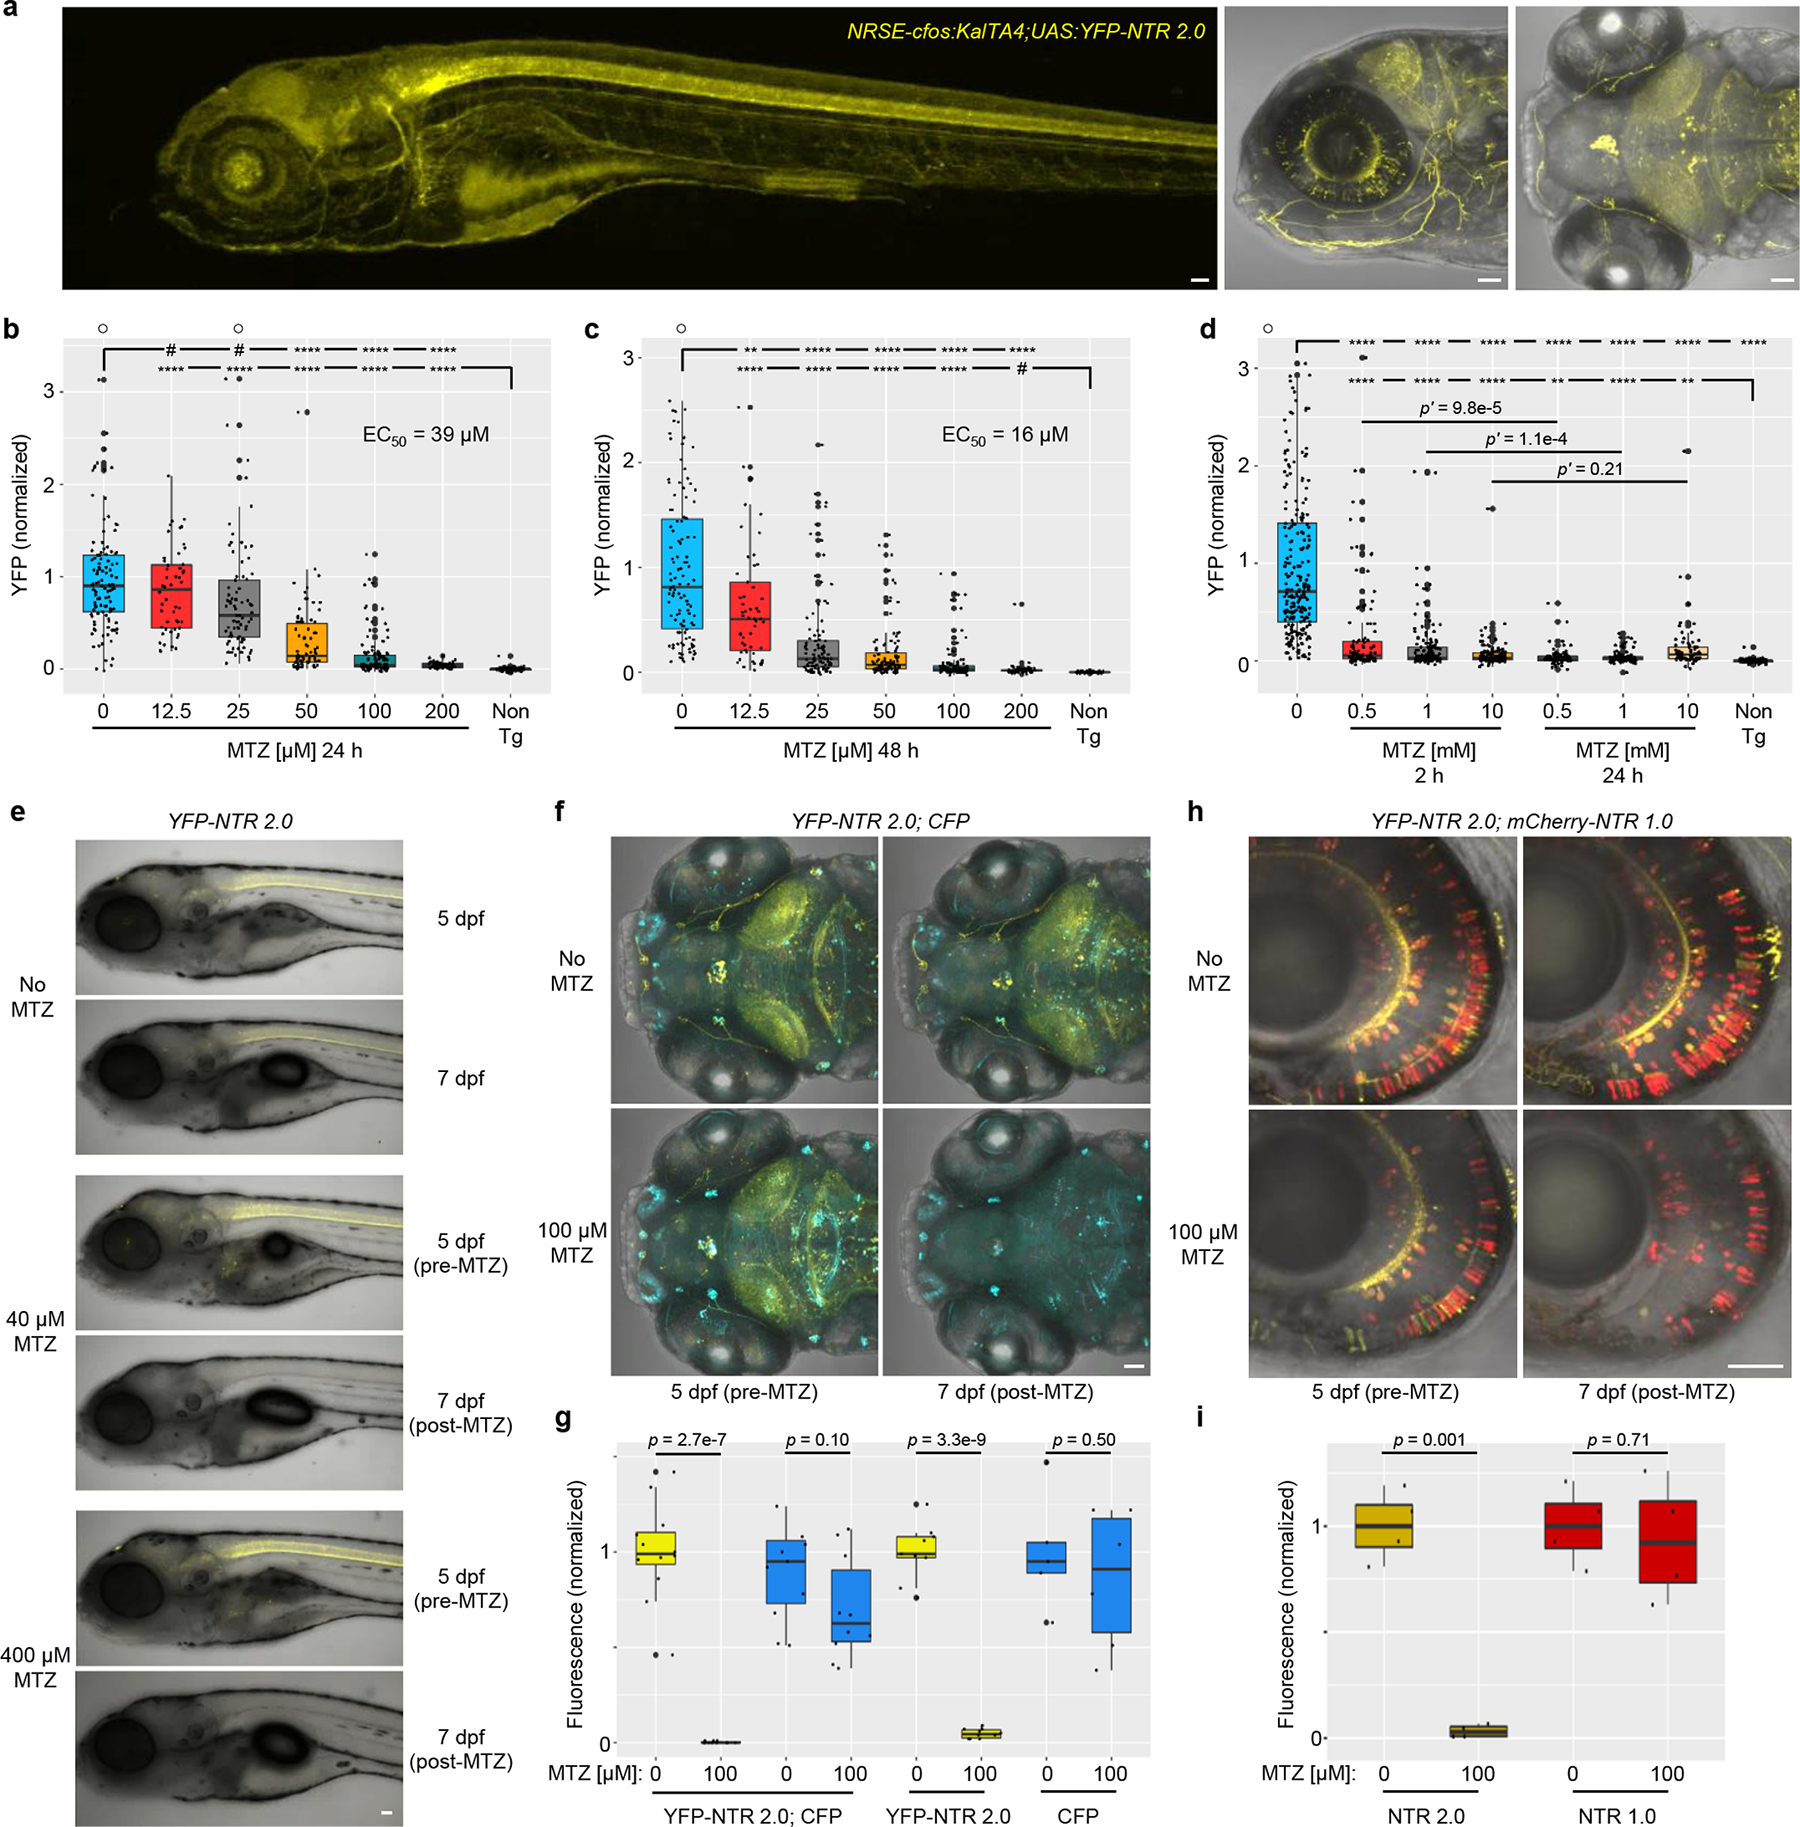
Fig. 3: NTR 2.0 enhances cell ablation efficacy in zebrafish.

a, Confocal images of 5 dpf NRSE:KalTA4;UAS:YFP-NTR2.0 larvae showing neuronally-restricted YFP expression (co-expressed with NTR 2.0), n=4 biologically independent experiments, 24 larvae examined. b-d, Dose-response tests of MTZ ablation efficacy. 5 dpf NRSE:KalTA4;UAS:YFP-NTR2.0 larvae were exposed to MTZ for 24 h (b), 48 h (c), or either 2 or 24 h (d). Fully detailed statistical comparisons (absolute effect sizes, 95% confidence intervals, Bonferroni-corrected p’-values derived from two-tailed t tests, sample sizes, and the number of biologically independent experiments) between MTZ-treated and control conditions in graphs b-d are provided in Supp. Table 1. e, Representative time series images showing changes in YFP fluorescence in NRSE:KalTA4;UAS:YFP-NTR2.0 larvae treated with 0, 40, or 400 μM MTZ from 5–6 dpf, n=2 biologically independent experiments, 16 larvae imaged per condition. f-g, Test of NTR 2.0 ablation specificity. f, Representative time-series images showing changes in YFP and CFP fluorescence in in NRSE:KalTA4;UAS:YFP-NTR2.0;UAS:CFP larvae treated with 100 μM MTZ from 5–6 dpf, n=4 biologically independent experiments, 24 larvae imaged per condition. g, Imaris-based quantification of changes in YFP and CFP fluorescence in control and MTZ-treated larvae, n=4 biologically independent experiments, dot plots show the number of larvae examined. h-i, Ablation efficacy comparison of NTR 1.0 and NTR 2.0. h, Representative time-series images shows changes in YFP and mCherry fluorescence in nyx:KalTA4; UAS:YFP-NTR2.0;UAS:NTR 1.0-mCherry larvae treated with 100 μM MTZ from 5–6 dpf changes, n=2 biologically independent experiments, 16 larvae imaged per condition. i, Imaris-based quantification of changes in YFP and mCherry fluorescence in control and MTZ-treated larvae, n=2 biologically independent experiments, dot plots show the number of images examined. A two-tailed t test was used to calculate p-values comparing MTZ-treated larvae to corresponding controls per genotype in g and i. All box plots show first quartiles (25th percentile), medians, third quartiles (75th percentile), and whiskers = SD, with individual data points (larvae or images) overlaid as a dot plot. Symbols: #p’ > 0.05, *p’ ≤ 0.05, **p’ ≤ 0.01, ***p’ ≤ 0.001, ****p’ ≤0.0001 ○ = outlier data points. Scale bars = 50 microns.
