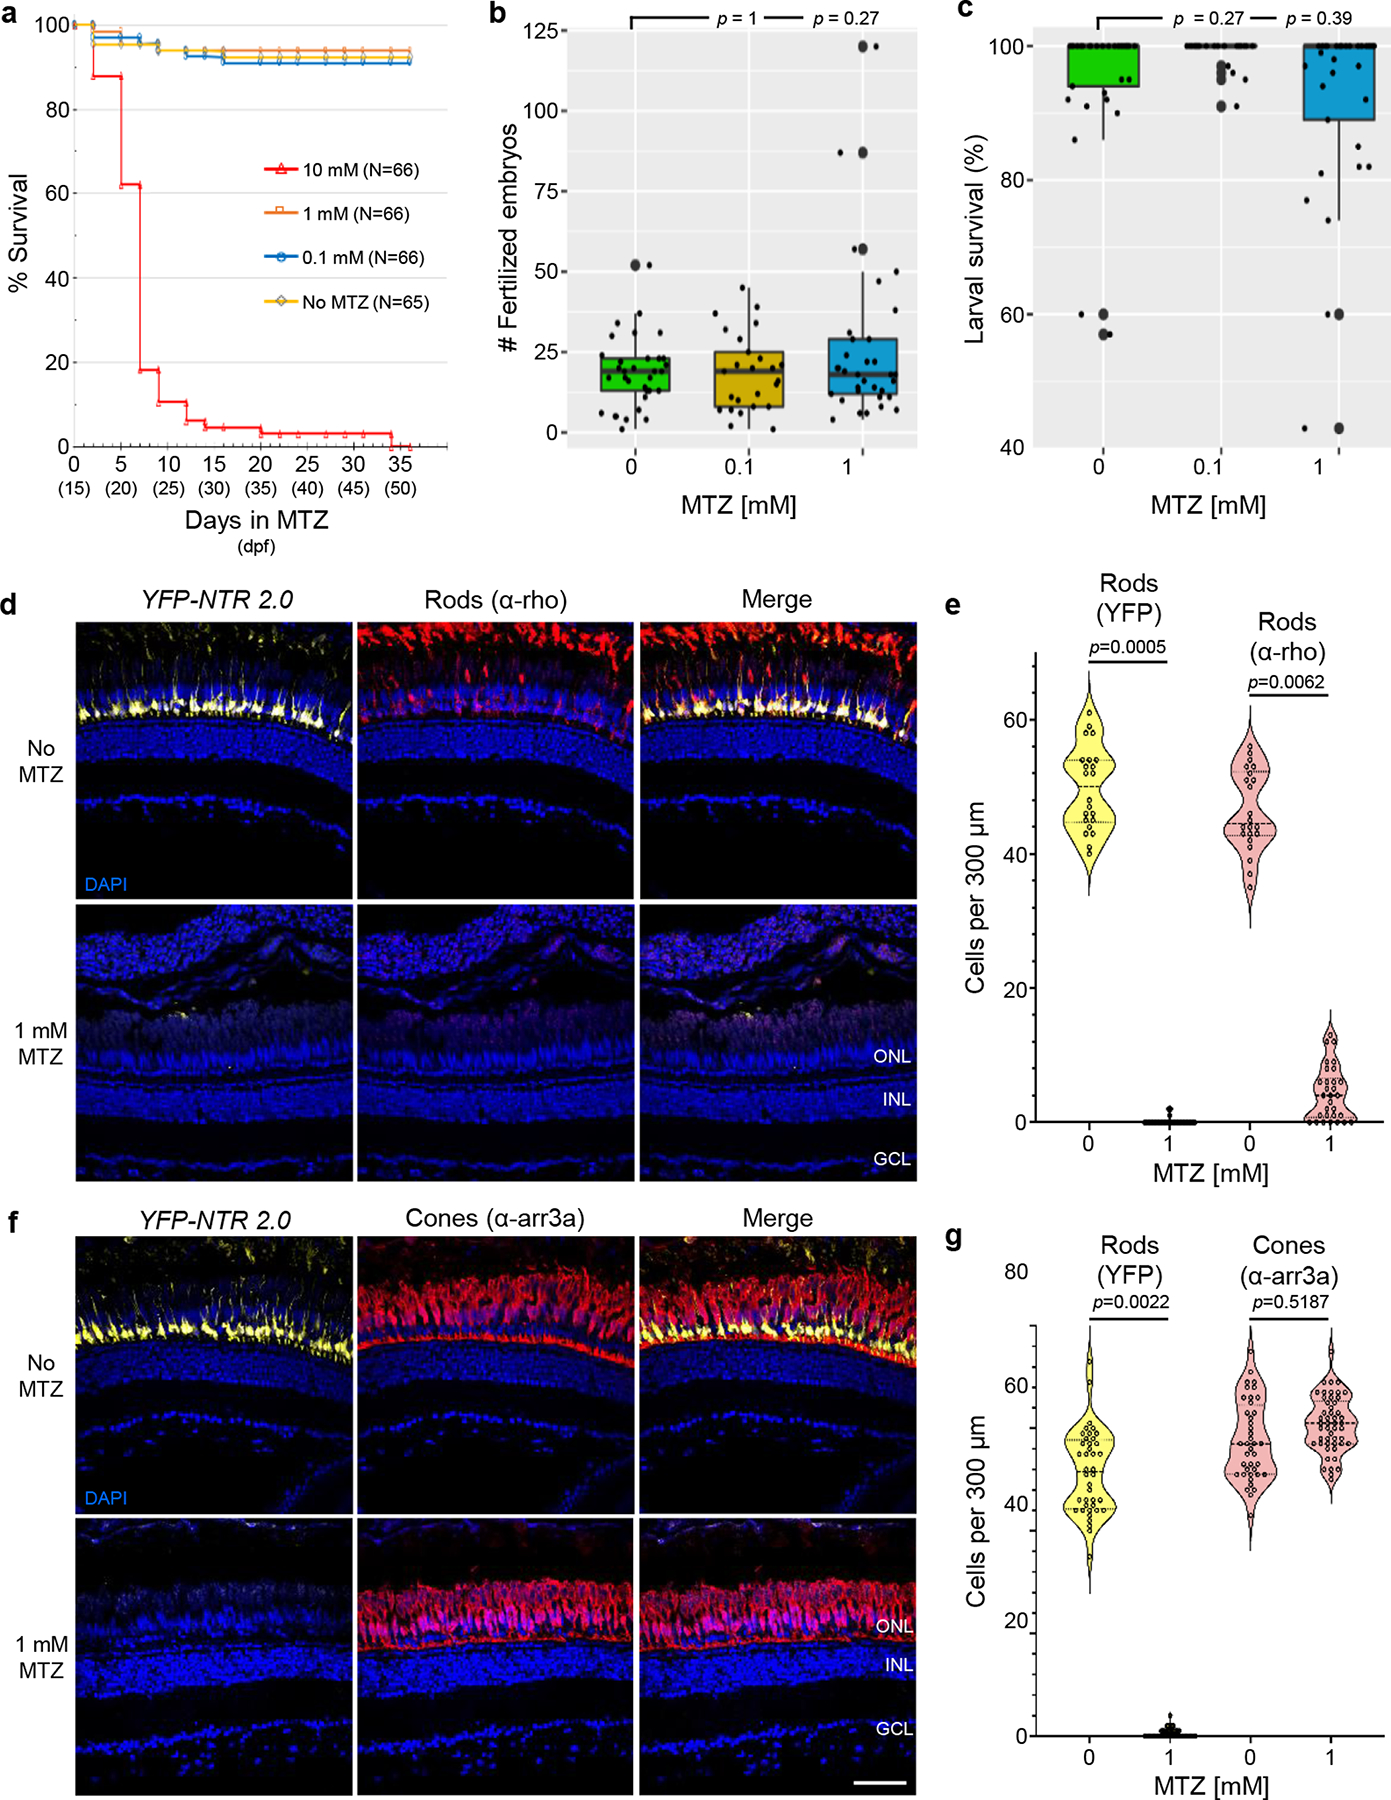
Fig. 5: Prolonged MTZ treatments are non-toxic and retain targeted ablation specificity in adults.

a, Survival of juvenile zebrafish incubated with the indicated concentration of MTZ for 36 days, from 15–51 dpf (n=66 or 65 larvae examined per condition – see inset, n=3 biologically independent experiments). Log-rank (Mantel-Cox) tests and Gehan-Breslow-Wilcoxon tests showed no statistically significant differences between No MTZ controls and 0.1 or 1 mM MTZ conditions. Comparisons between No MTZ controls and the 10 mM condition produced chi-squares of 123 and 97, respectively, and a Bonferroni corrected p’-value of <0.0001 for both tests. b-c, Test of fecundity (b) and offspring survival (c) rates of long-term MTZ exposed fish (n=3 independent mating sessions). Box plots show first quartiles (25th percentile), medians, third quartiles (75th percentile), and whiskers = SD, with individual data points (successful matings) overlaid as a dot plot. Fully detailed statistical comparisons (absolute effect sizes, 95% confidence intervals, Bonferroni-corrected p’-values derived from two-tailed t tests, and sample sizes) between MTZ-treated and control conditions in graphs b-c are provided in Supp. Table 3. d-g, Test of NTR 2.0/MTZ-induced ablation efficacy and specificity in adult zebrafish (n=2 zebrafish per condition). Transgenic rho:YFP-NTR2.0 adult zebrafish were treated ±1 mM MTZ for 3 days. Retinas were then fixed, sectioned, and labeled with the nuclear stain DAPI (blue cells) and an antibody specific to rod (α-rho, red cells, d), or cone photoreceptors (α-arr3a, red cells, f). Representative confocal images of YFP-expressing rods (yellow cells, d and f) and antibody labeling show effective ablation of NTR 2.0-expressing rod photoreceptors (d) and maintenance of neighboring cone photoreceptors (f). Manual quantification of YFP-expressing rod cells and either α-rho stained rods (e) or α-arr3a stained cones. Violin plots show first quartiles (25th percentile), medians, third quartiles (75th percentile), and the full distribution of the data, with individual data points (number of measurements per condition) overlaid as a dot plot. A two-tailed nested t test (GraphPad, Prism 9) was used to calculate p-values comparing MTZ-treated and control larvae. Abbreviations: ONL, outer nuclear layer; INL, inner nuclear layer; GCL, ganglion cell layer. Scale bars = 50 microns.
