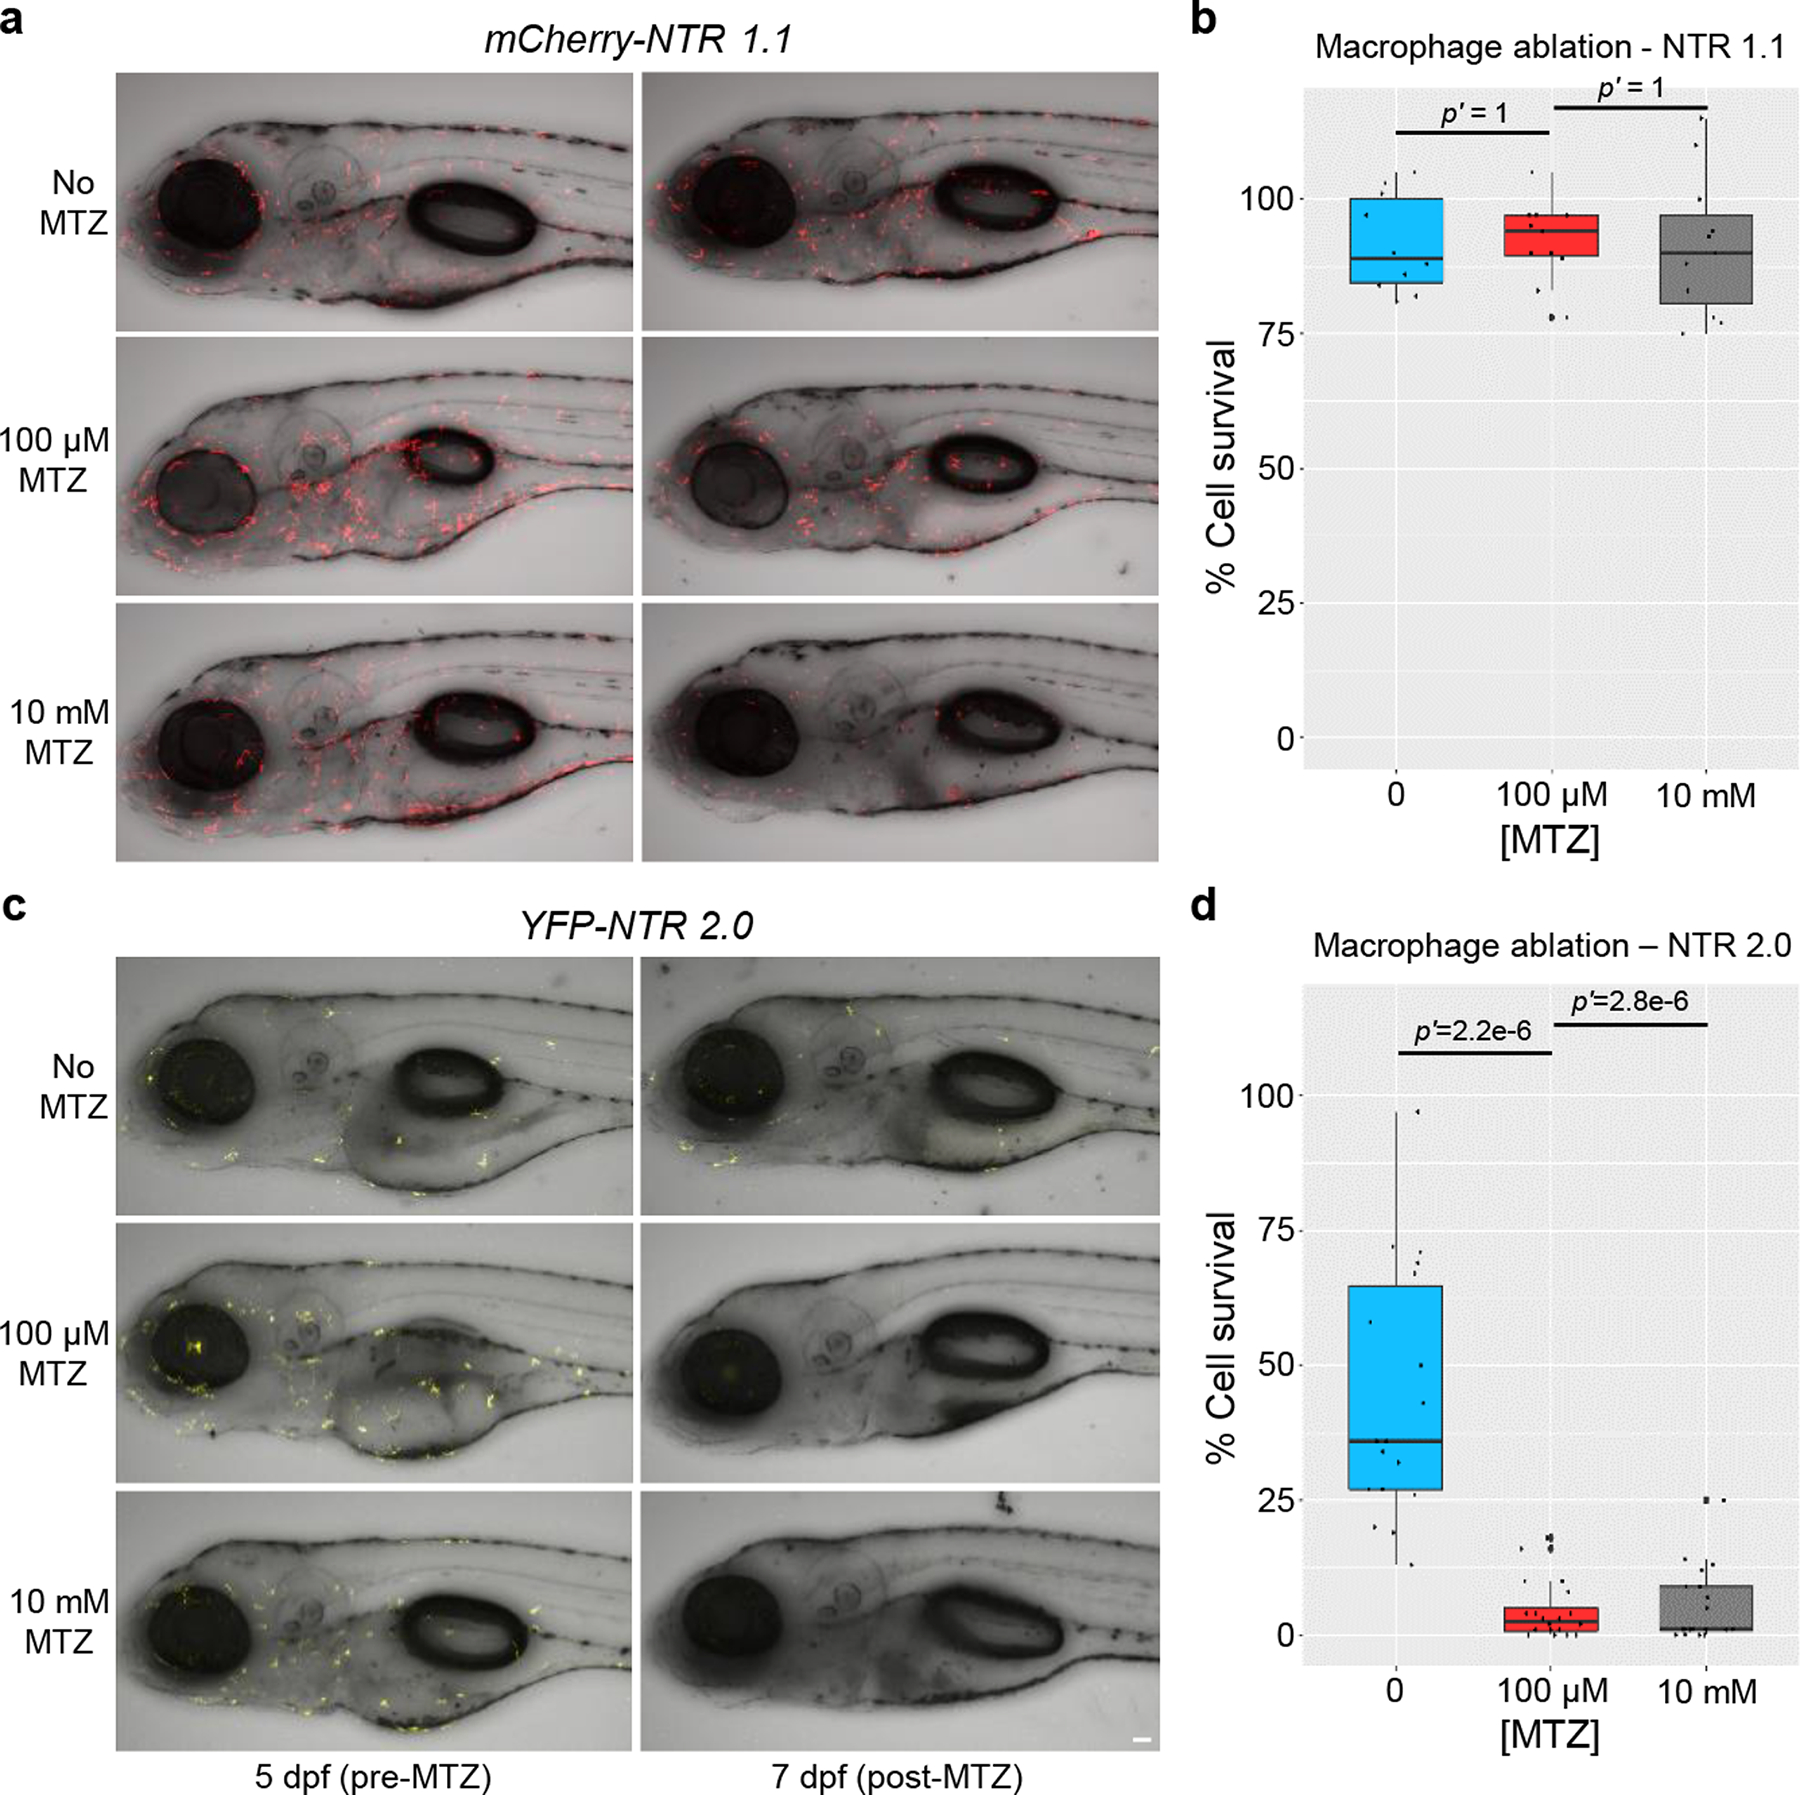
Fig. 6: NTR 2.0 enables ablation of “resistant” cell types.

Transgenic larvae co-expressing either mCherry and NTR 1.1 (a,b) or YFP and NTR 2.0 (c,d) in macrophages were treated with 0, 0.1, or 10 mM MTZ from 5–7 dpf, n=3 biologically independent experiments for both assays. a,c, Intravital time series imaging was performed pre-MTZ (5 dpf) and post-MTZ (7 dpf). b,d, Manual counts of macrophage numbers were performed on pre- and post-treatment images. The percent change in cell number was calculated by normalizing day 7 to day 5 image values per each fish. No change in cell number was observed in NTR 1.1 expressing fish (b) due to the persistence of small rounded cells (n=10, 11, and 11 larvae examined, for 0, 0.1, and 10 mM MTZ conditions, respectively). Conversely, both treatment conditions led to near complete ablation of NTR 2.0-expressing macrophages (d; n=18, 20, and 19 larvae examined, for 0, 0.1, and 10 mM MTZ conditions, respectively). Fully detailed statistical comparisons (absolute effect sizes, 95% confidence intervals, Bonferroni-corrected p’-values derived from two-tailed t tests, and sample sizes) between MTZ-treated and control conditions in graphs b and d are provided in Supp. Table 4. Scale bar = 50 microns.
