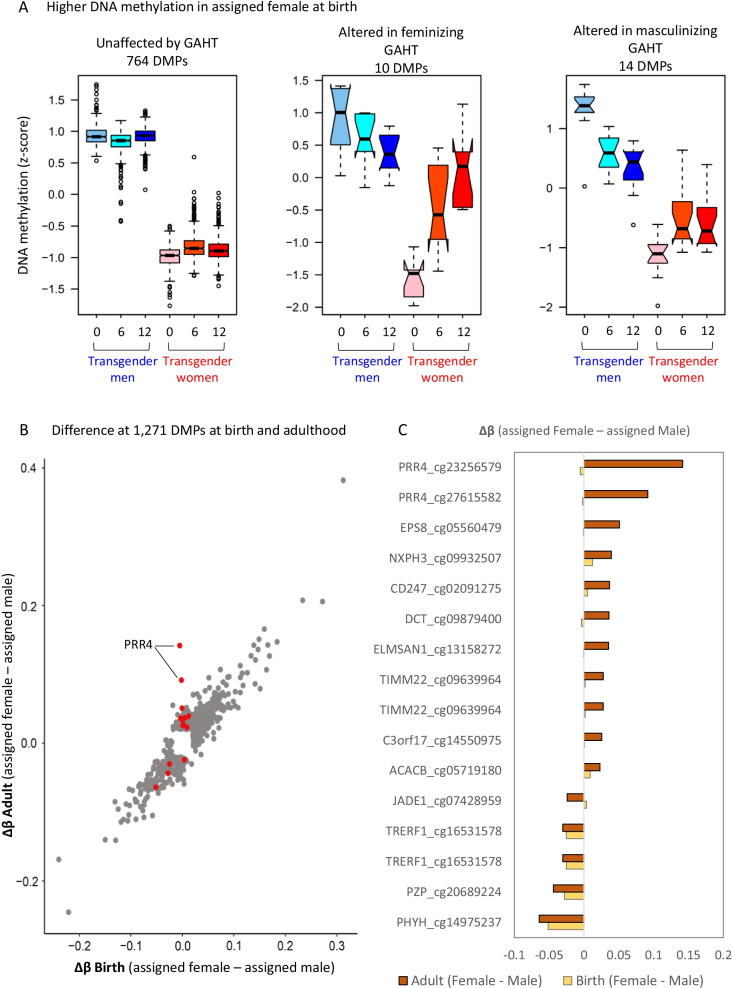
Fig. 6.
GAHT specifically influences age-associated sex-specific DMPs. A Boxplot of DNA methylation (z-scored) of sex-specific autosomal DMPs that show higher DNA methylation in people assigned female at birth compared to people assigned male at birth in our cohort (p value < 0.01, mean Δβ < − 0.05). See Additional file 10: Fig. S8 for X chromosome and autosomal DMPs with lower DNA methylation in people assigned female at birth. 764 DMPs are not affected by GAHT, while 10 and 14 DMPs are significant in the feminizing or masculinizing GAHT comparisons, respectively (mean Δβ > 0.02 or < − 0.02, p value < 0.05). B Scatter plot of change in DNA methylation (Δβ) between people assigned female and people assigned male at time of birth (Guthrie cards) (x axis) or in adulthood (y axis) based on a publicly available dataset (GSE131433). Red dots represent probes that are significant in transgender women or transgender men comparisons, grey dots are not significant. The red dots are generally different between sexes in adults, but not at birth. C Bar plot showing change in DNA methylation between sexes at probes shown in red in B, in adults (brown) and at birth (yellow)

