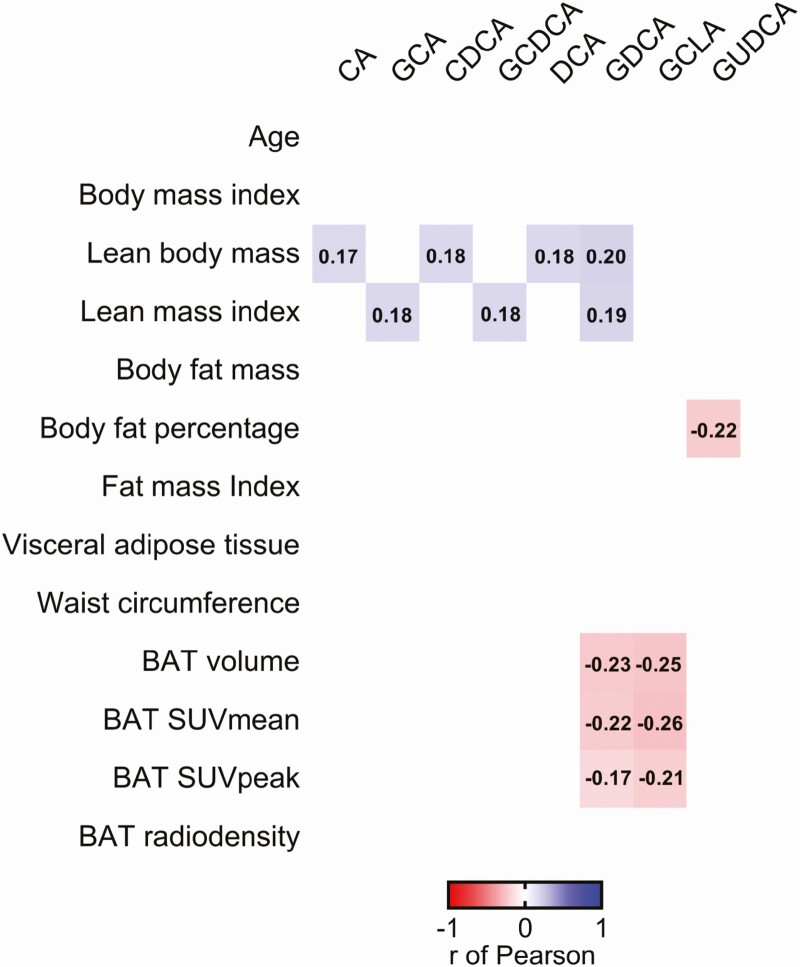
Figure 1.
Correlations between plasma levels of bile acids with body composition and brown adipose tissue parameters in young adults (n = 133). Every colored box represents a significant correlation coefficient (all P < 0.05), whereas invisible (white) boxes represent nonsignificant correlations. Values within the boxes express the r of Pearson coefficient. Bile acids concentration values were log10 transformed. Abbreviations: BAT, brown adipose tissue; CA, cholic acid; CDCA, chenodeoxycholic acid; DCA, deoxycholic acid; GCA, glycocholic acid; GCDCA, glycochenodeoxycholic acid; GDCA, glycodeoxycholic acid; GLCA, glycolithocholic acid; GUDCA, glycoursodeoxycholic acid; SUV, standardized uptake value.

