Figure 3.

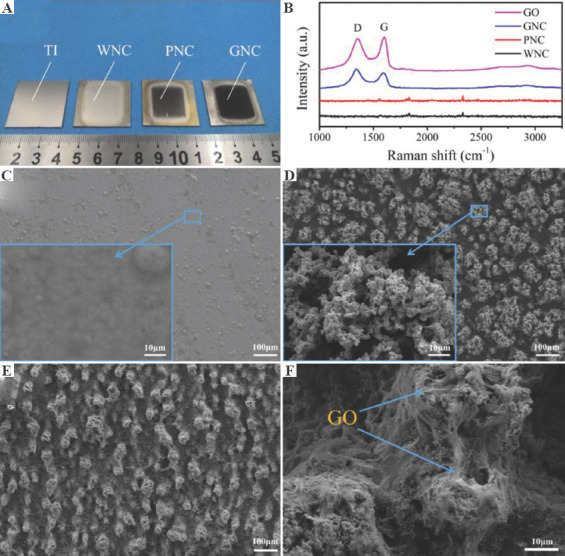
(A) Photos of samples. (B) Raman spectrum of graphene oxide and coated samples. The morphology of (C) WNC, (D) PNC, and (E-F) GNC.

(A) Photos of samples. (B) Raman spectrum of graphene oxide and coated samples. The morphology of (C) WNC, (D) PNC, and (E-F) GNC.