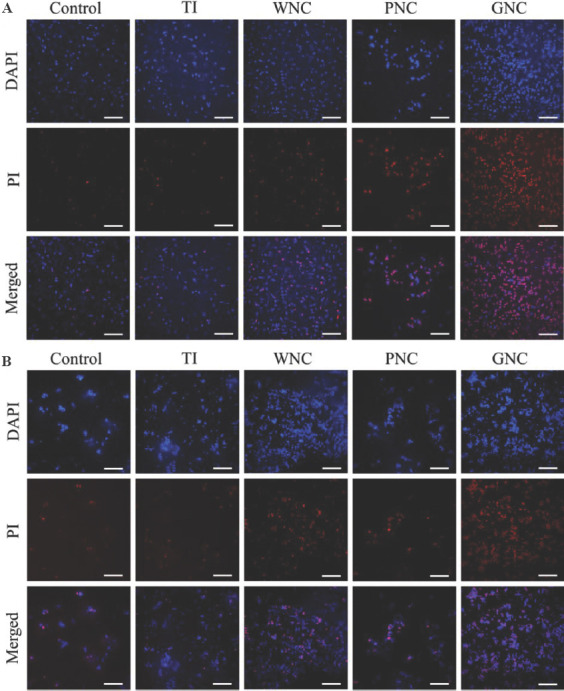
Figure 6.

Live/dead staining fluorescent images of Escherichia coli and Staphylococcus aureus. (A) E. coli cells were inoculated on the sample surfaces and incubated for 2 h. (B) S. aureus cells were inoculated on the samples surfaces and incubated for 2 h. Scale bar: 20 μm.
