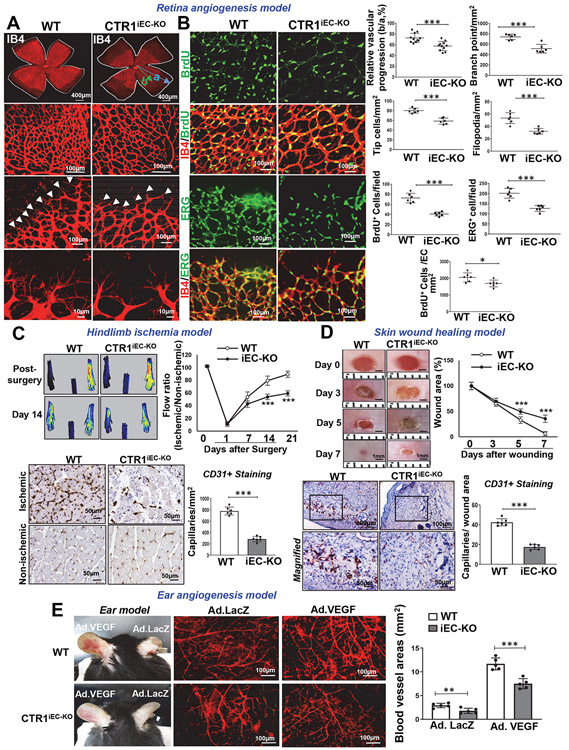
Figure 1: Endothelial CTR1 is required for postnatal angiogenesis in vivo.
A and B. Retinal whole-mount staining with Isolectin B4 (IB4) of P6 WT and CTR1iECKO mice. Arrowheads show tip cell sprouting and filopodia (A). BrdU or ERG (endothelial nuclei marker)(green) co-stained with or without IB4 (red) in P6 retinal flatmounts of WT and CTR1iECKO mice (B). Right panels show quantification of vascular progression length, numbers of branch point, tip cells and filopodia (A) and BrdU -or ERG-positive cells or endothelial BrdU-positive cells in the field (B), (vascular progression: n=11 samples each for WT and CTR1iECKO; branch point, tip cells, filopodia, BrdU+, ERG+: n=6 samples each for WT and CTR1iECKO respectively, compared with two-tailed unpaired t-test). C. Blood flow recovery after hindlimb ischemia as determined by the ratio of foot perfusion between ischemic (left) and non-ischemic (right) legs in WT and CTR1iECKO mice (right), two-way ANOVA followed by Bonferroni’s multiple comparison analysis. Left panels show representative laser Doppler images of legs at day 14. Bottom panels show CD31+ staining (capillary density) in ischemic and nonischemic gastrocnemius muscles at day 14. Right panel shows quantification, (n=6 mice per group, representative of two independent experiments, compared with two-tailed unpaired t-test). D. Excisional cutaneous wounds were created using a 3 mm biopsy punch on the dorsal skin of WT and CTR1iECKO mice. Ruler notches=1 mm. Right panel shows the quantification of wound closure rates, two-way ANOVA followed by Bonferroni’s multiple comparison analysis. Bottom images show CD31 staining of wounded tissues at day 7 with magnified images in Box. Right panel shows quantification, (n=6 mice per group, representative of two independent experiments, compared with two-tailed unpaired t-test). E. Adenovirus encoding VEGF164 (1×10⁹ pfu) (Ad-VEGF) or β-galactosidase (Ad-LacZ) was intradermally injected into the right and left ear skin of WT and CTR1iECKO mice, respectively. Ear vasculature (red) was visualized by a whole-mount staining with CD31. Right panel shows the quantification of vessel density. (n=5 mice per group, representative of two independent experiments, two-tailed unpaired t-test. *p<0.05, **p<0.005, ***p<0.001. Data are mean ± SEM). Source numerical data are available in source data.

