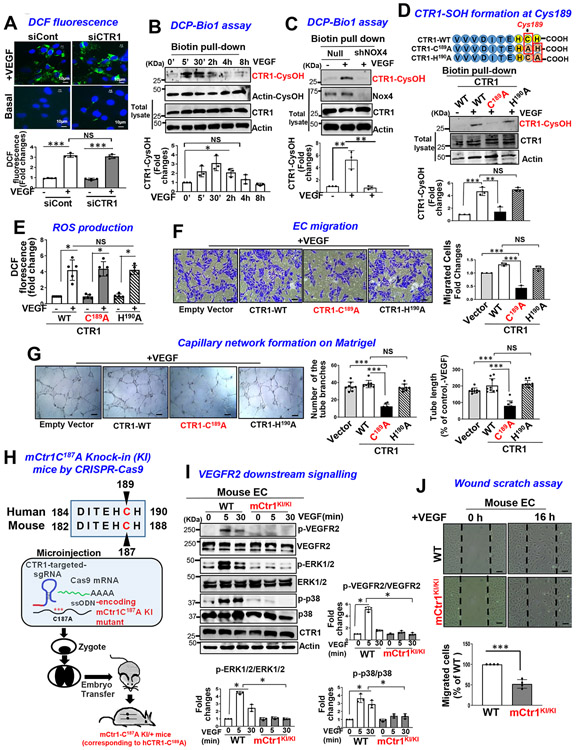
Figure 3: VEGF induces CTR1-Cys189OH formation, which promotes angiogenesis in ECs.
A. HUVECs transfected with control or CTR1 siRNAs stimulated with VEGF (20 ng/ml) for 5 min were used for dichlorofluorescein (DCF) fluorescence and DAPI staining (blue). Bottom panel represents the averaged fold change from the basal control (n=3 biologically independent experiments, one-way ANOVA followed by Bonferroni’s multiple comparison analysis). B, C, D. HUVECs stimulated with VEGF for indicated time (B), or HUVECs infected with Ad.null or Ad.shNox4 (C), or transfected with Flag-hCTR1-WT, Flag-hCTR1-C189A or Flag-hCTR1-H190A (D) stimulated with VEGF for 5 min were used for DCP-Bio1 assay. In D, top panel: Amino acid sequence of the human CTR1 C terminus in WT and two mutants (CTR1-WT, CTR1-C189A, CTR1-H190A). DCP-Bio1-labeled lysates pulled down with streptavidin beads were immunoblotted (IB) with anti-CTR1 or actin (B) or anti-CTR1 (C) or Flag (D) to measure CTR1-CysOH formation. (n=3 biologically independent experiments, two-tailed unpaired t-test). *p =0.0143, ** P=0.0072, **P=0.0063, ***P=0.0006, **P=0.005. E, F, G. HUVECs transfected with empty vector, Flag-CTR1-WT, Flag-CTR1-C189A or Flag-CTR1-H190A were used to measure DCF fluorescence stimulated with VEGF for 5 min (E), or EC migration (Boyden chamber assay) stimulated with VEGF for 6 h (F), or capillary network formation on Matrigel stimulated with VEGF for 4 h. Scale bars=50μm. G. Bar graphs represent the averaged fold change from the basal control. H. Schematic diagram of CRISPR-generated “redox dead” mCtr1-C187A (human CTR1-C189A) knock-in (KI)(mCtr1KI/+ mice. CRISPR sgRNA targeting the mCtr1 gene, Cas9 mRNA, and single stranded oligo donor DNA (ssODN) encoding CTR1 mutations was injected into mouse zygotes. I and J. Aortic ECs from WT and mCtr1KI/KI mice were used to measure VEGF signaling using Western blots (I) or EC migration using a wound scratch assay. Scale bars=50μm. J. Graph represents the averaged % of migrated cells at wounded area compared to WT ECs. E, F, G, I and J. (n=3 biologically independent cells, two-tailed unpaired t-test). *p<0.05, **p<0.01, ***p<0.001. NS=not significant. Data are mean ± SEM. Source numerical data and unprocessed blots are available in source data.

