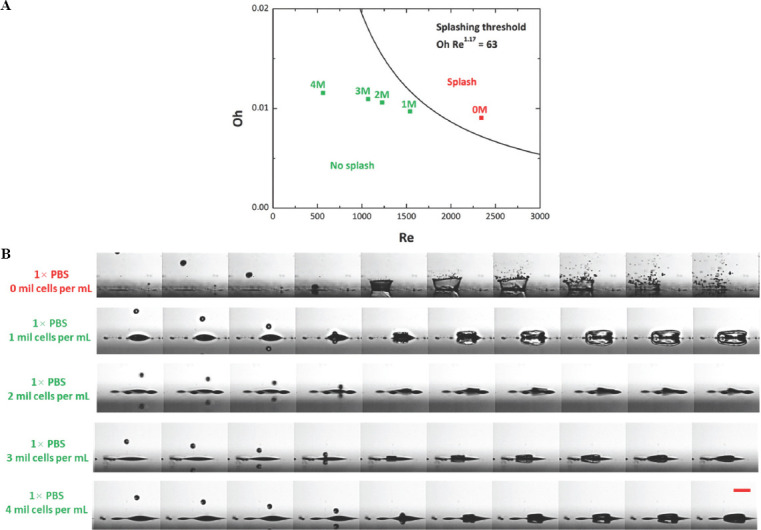
Figure 4.

(A) Phase diagram of droplet splashing phenomenon computed using the splashing boundary conditions. (B) Representative high-speed images of ejected droplet hitting the substrate surface at varying cell concentration (0 – 4 million cells/mL) at 5× zoom and the images are taken at 144,000 fps. Increasing the cell concentration resulted in slower droplet velocity which helps to mitigate droplet splashing when hitting the pre-wetted surface; scale bar = 250 μm.
