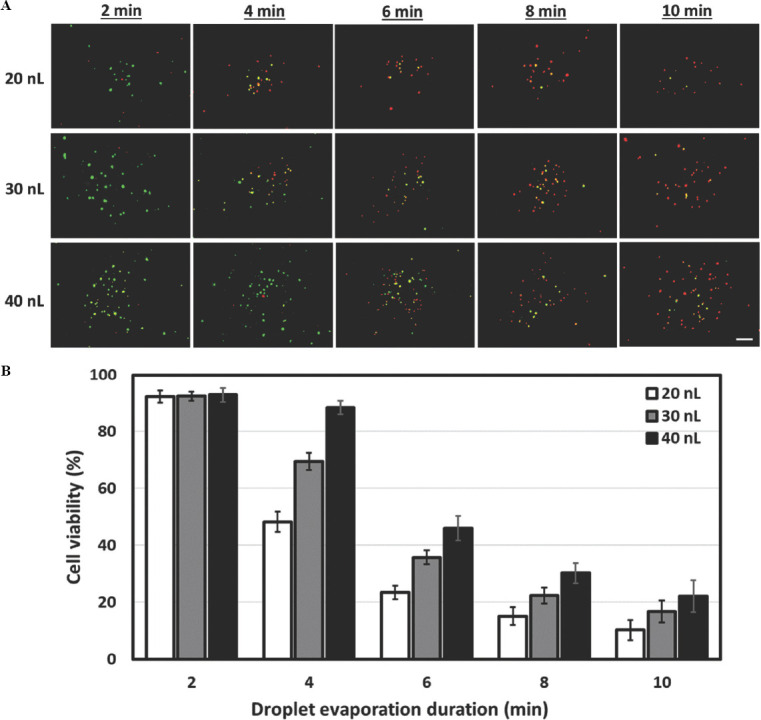
Figure 7.

Influence of time on evaporation and viability of nanoliter cell-laden droplets (4 million cells/mL at varying total dispensed volumes of 20, 30, and 40 nL) over a period of 10 min. (A) Representative fluorescence images of printed cells on dry well-plates stained using Live/Dead cell viability assay (green – viable cells, red – dead cells) at different time points (2, 4, 6, 8 and 10-min interval); scale bar = 200 μm. (B) A graph showing the change in cell viability (%) for different total dispensed volumes at different droplet evaporation duration.
