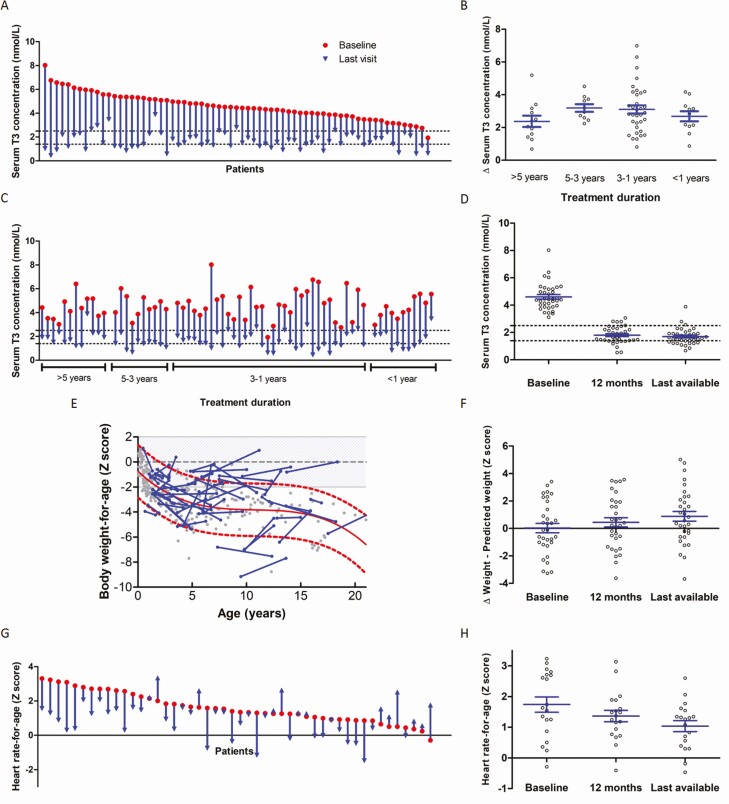
Figure 1.
Changes from baseline to interim evaluation and last visit in primary and secondary outcomes (anthropometric parameters). Data are changes in serum concentrations of T3 between baseline and last available follow-up visit on treatment with Triac: A, by patient; B, change in serum T3 between baseline and last available follow-up visit after stratification based on treatment duration; C, by patient, ordered by treatment duration). Panel D shows the change in serum T3 concentrations from baseline to 1 year and last available visit (longitudinal within-subject analyses; n = 36). Panel E shows change in body weight-for-age between baseline and last visit (blue dots and lines; n = 55); the natural history of untreated patients with MCT8 deficiency is depicted in grey dots with the historical reference line in red (with the 95% error band in dashed lines), based on a historical control cohort (8). Panel F shows the change in difference between the body weight-for-age Z-score and the expected Z-score based on the natural history data on the corresponding age from baseline to 1 year and last available visit (longitudinal within-subject analyses; n = 32). Panel G shows change in heart rate-for-age from baseline to last visit (n = 48). Panel H shows the change in heart rate-for-age from baseline to 1 year and last available visit (longitudinal within-subject analyses; n = 19). Median treatment duration was 2.2 years (interquartile range [IQR] 1.2–3.7 years) for analyses of the primary outcome (panels A, B, and C), 2.2 years (IQR 1.5–3.9 years) for analyses of secondary outcomes (panels E and G), and 3.6 years (IQR 2.5–5.2 years) for longitudinal within-subject analyses (panels D, F, and H). Red dots represent baseline measurement and blue arrows represent the last available measurement in panels A, C, and G. Grey dots represent measurements in the individual patients in panels B, D, F, and H; means and standard error of the mean (SEM) are displayed in blue. Black dashed lines represent the target range in panels A, C, and D. Of the patients with a decrease in body weight-for-age compared with the reference line, 7 (78%) of 9 patients were known to have feeding problems, and only 2 (22%) of 9 patients had a feeding tube in place (information not available for 4 patients), compared with 36% of patients in the rest of the group. Body weight-for-age Z scores were calculated using TNO growth calculator and heart rate-for-age Z scores were calculated using the Boston Z score calculator. Abbreviations: T3, triiodothyronine; T4=thyroxine.

