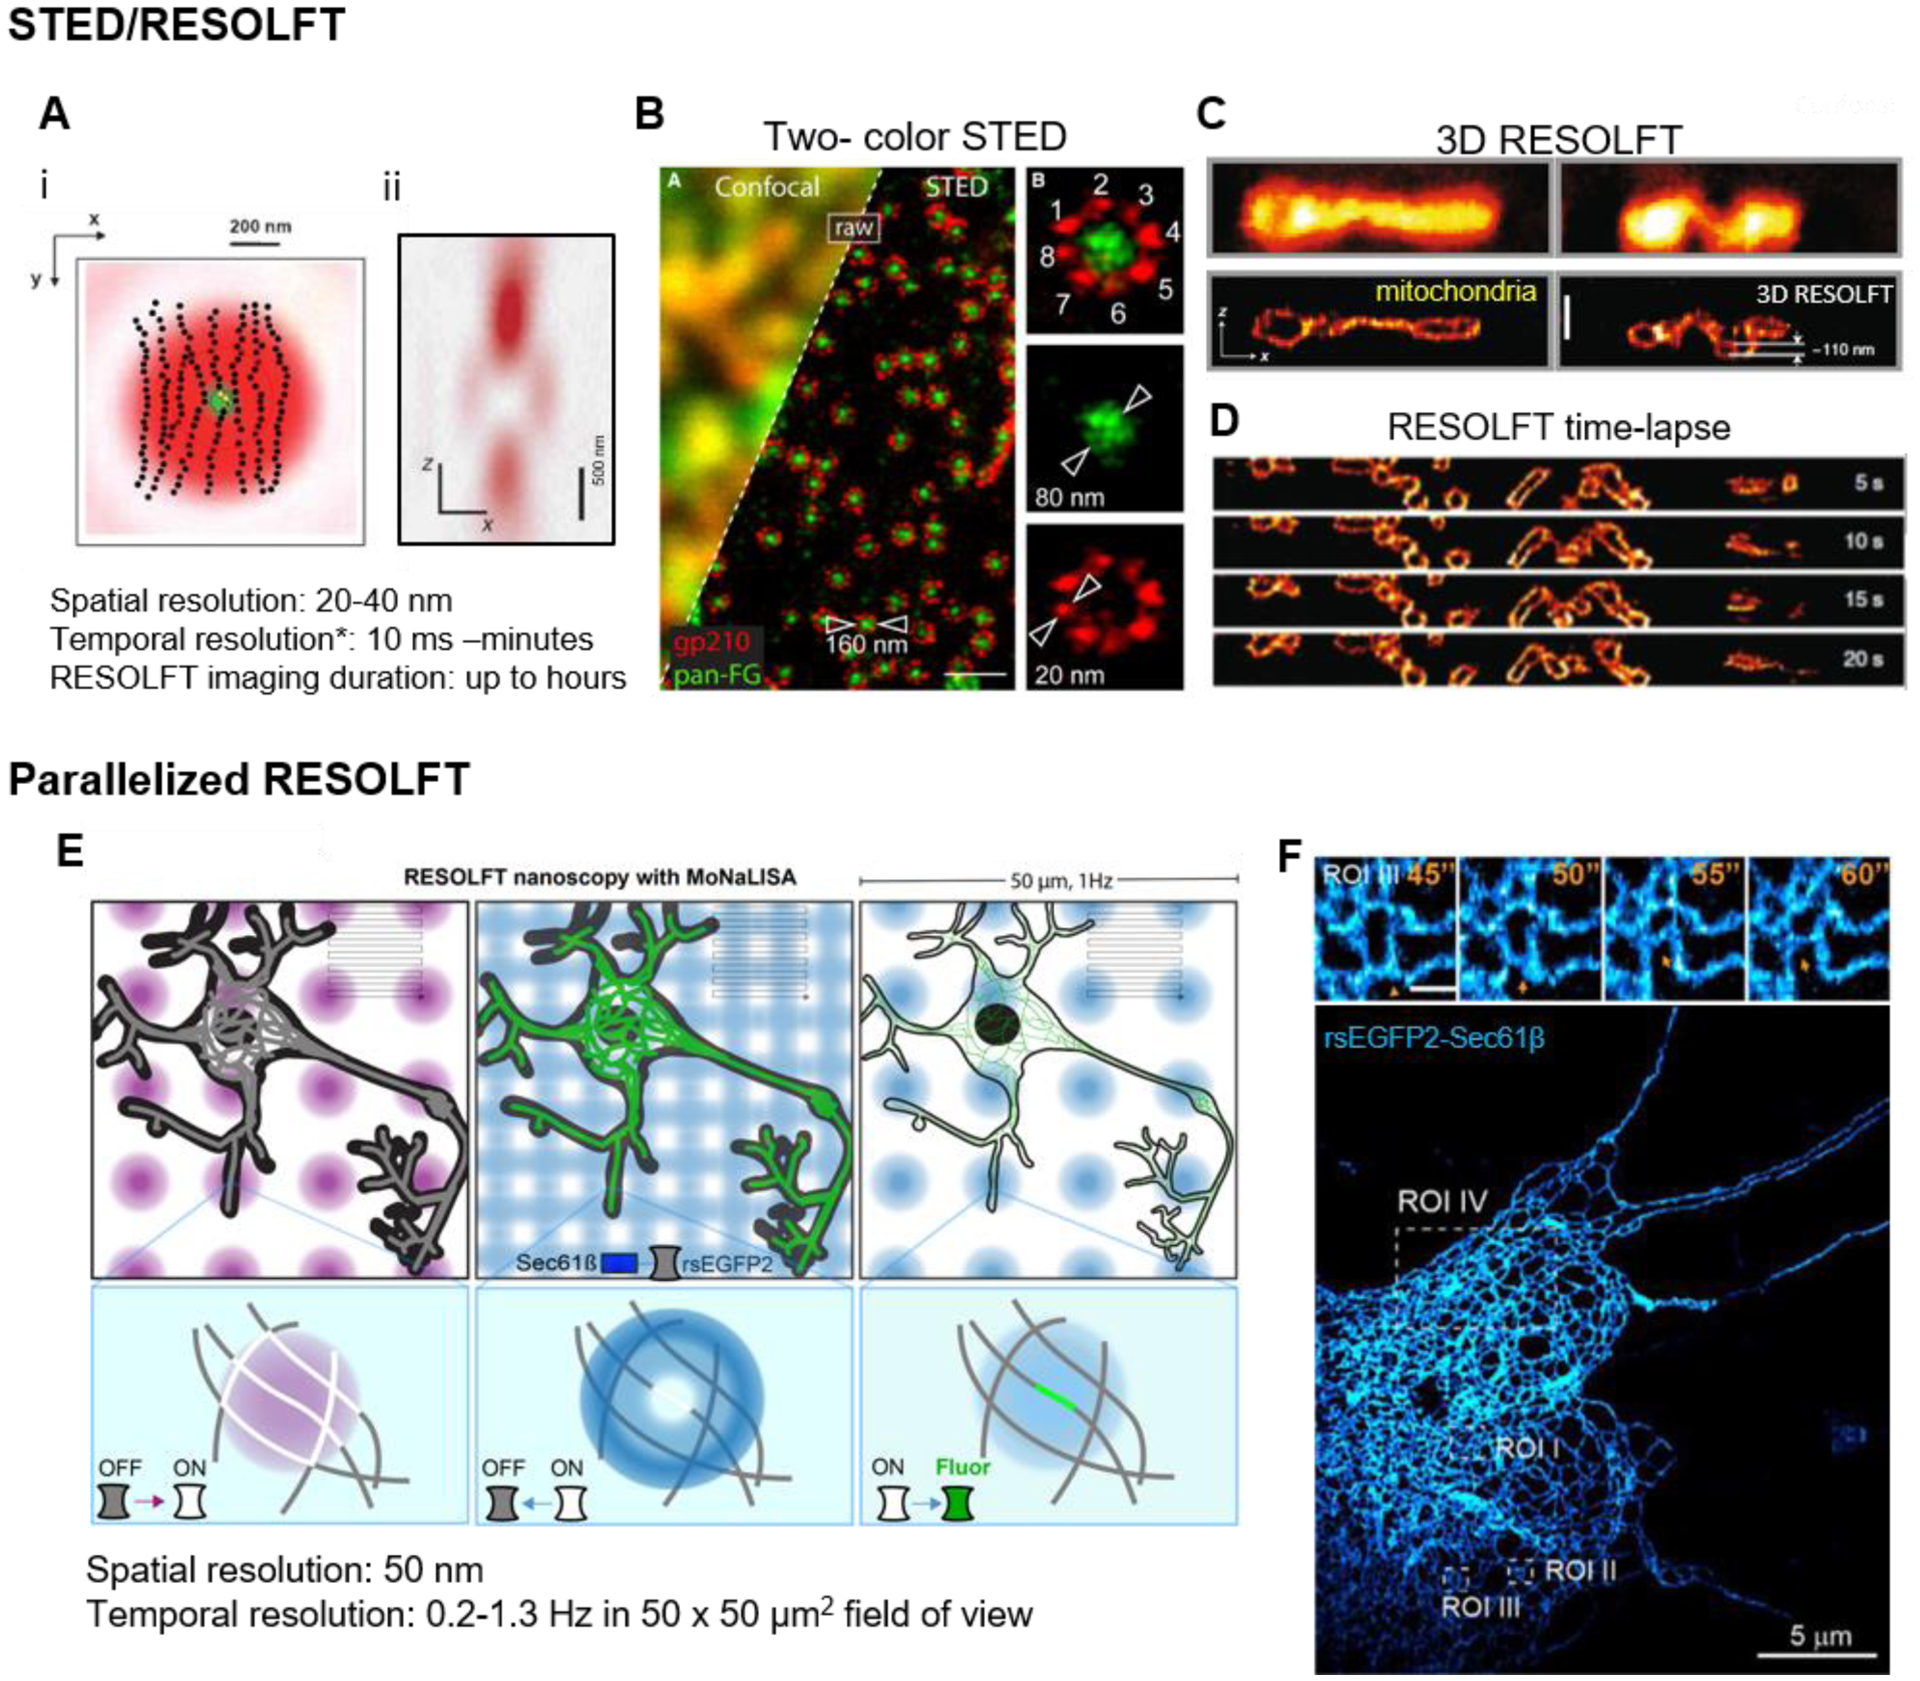
Figure 1: STED and RESOLFT.

(A) (i) STED depletion beam (red) geometry in lateral (x,y) dimension overlayed with the excitation beam (green), and (ii) cross-section of the z depletion beam to improve axial resolution (Hell, 2015; Willig et al., 2007). The intensity at center of the STED beam is zero, which allows for the few molecules there remain fluorescent (yellow dots) while the surrounding molecules are forced to the dark state (black dots). *temporal resolution scales inversely with the size of the field-of-view. (B) Two-color STED image of Xenopus nuclear pore complex. Scale bar, 500 nm (Göttfert et al., 2013). (C) 3D volumetric RESOLFT image of mitochondria in the axial direction in a U2OS cell expressing rsEGFP2-Omp25. Upper two panels, enhanced confocal images without 3D off-switching. Lower two panels, 3D RESOLFT images. Scale bar, 500 nm (Bodén et al., 2021). (D) Axial mitochondria dynamics (rsEGFP2-Omp25) captured by 3D RESOLFT (Bodén et al., 2021). (E) The scheme of parallelized RESOLFT (MoNaLISA) imaging the neuronal ER labeled with rsEGFP2-Sec61β (Damenti et al., 2021). The imaging setup includes parallelized foci switch-on/off and readout as illustrated. These foci only need to scan a limited fraction of the whole field (indicated by the gray lines) to cover a large 50 μm2 field of view. (F) An extensive ER network (rsEGFP2-Sec61β) in a hippocampal neuron, super-resolved by parallelized RESOLFT. Scale bar, 5 μm. Inset: zoomed in dynamics of ER at 0.2 Hz in the ROI II. Scale bar, 500 nm.
